|
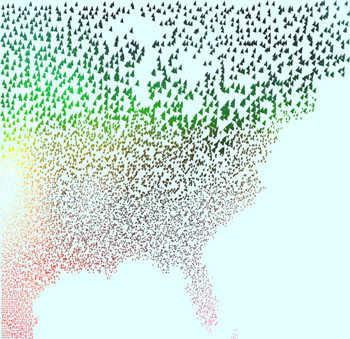
An example of a perceptually-motivated
multidimensional visualization of
recent U.S. election results
(larger image
or high-resolution
PDF), each of the 435 congressional districts across the 50
United States are subdivided into four quadrants to show which
party's candidate the district's voters selected for the 2004
Presidential election (upper-left quadrant), the most recent
U.S. Senate election (upper-right), 2006 U.S. House election
(lower-right), and the most recent Governor election
(lower-left); color represents party (blue for Democrat, red for
Republican, green for Independent), and saturation represents
the winning percentage (more saturated for higher percentages);
the small disc floating over each state shows aggregated
state-wide results; incumbent losses are highlighted with
textured X's; the height of a state represents the number of
electoral college votes it controls
|
Note: An extended version of this web page has been accepted
for publication in IEEE Transactions on Visualization and Computer
Graphics. A reprint of this article is available on my
publications page
(abstract
and PDF).
Introduction
Human perception plays an important role in the area of
visualization. An understanding of perception can significantly
improve both the quality and the quantity of information being
displayed [Ware 2000]. The importance of
perception was cited by the NSF panel on graphics and image processing
that proposed the term "scientific visualization"
[McCormick 87]. The need for perception was
again emphasized during a recent DOE/NSF panel on directions for
future research in visualization [Smith
98].
This document summarizes some of the existing theories in
psychophysics, and discusses their relevance to scientific and
information visualization. We begin with
an overview of preattentive processing,
the ability of the low-level human visual system to rapidly identify
certain basic visual properties. We
describe four theories of preattentive
processing, and briefly discuss related work
on postattentive vision
and feature hierarchies. We next
examine the new area of change
blindness. Research on this phenomena offers a different
perspective on early vision, suggesting that what we see can depend
critically on where attention is focused. Finally, we describe a
number of studies on the use of perception in
visualization.
Preattentive Processing
For many years vision researchers have been investigating how the
human visual system analyses images. An important initial result was
the discovery of a limited set of visual properties that are detected
very rapidly and accurately by the low-level visual system. These
properties were initially called preattentive, since their
detection seemed to precede focused attention. We now know that
attention plays a critical role in what we see, even at this early
stage of vision. The term preattentive continues to be used, however,
since it conveys an intuitive notion of the speed and ease with which
these properties are identified.
Typically, tasks that can be performed on large multi-element
displays in less than 200 to 250 milliseconds (msec) are considered
preattentive. Eye movements take at least 200 msec to initiate, and
random locations of the elements in the display ensure that attention
cannot be prefocused on any particular location, yet viewers report
that these tasks can be completed with very little effort. This
suggests that certain information in the display is processed in
parallel by the low-level visual system.
A simple example of a preattentive task is the detection of a red
circle in a group of blue circles (Fig. 1). The
target object has a visual property "red" that the blue
distractor objects do not (all non-target objects are considered
distractors). A viewer can tell at a glance whether the target is
present or absent.
(a)
|

(b)
|
|
Fig. 1: An example of searching for a target red circle based on
a difference in hue: (a) target is present in a sea of blue
circle distractors; (b) target is absent
|
In Fig. 1 the visual system identifies the
target through a difference in hue, specifically, a red target in a
sea of blue distractors. Hue is not the only visual feature which is
preattentive. In Fig. 2 the target is again a red
circle, while the distractors are red squares. As before, a viewer can
rapidly and accurately determine whether the target is present or
absent. Here, the visual system identifies the target through a
difference in curvature (or form).
(a)
|
(b)
|
|
Fig. 2: An example of searching for a target red circle based on
a difference in curvature: (a) target is absent in a sea of
red square distractors; (b) target is present
|
A unique visual property in the target (e.g., a red hue
in Fig. 1, or a curved form
in Fig. 2) allows it to "pop out" of a
display. A target made up of a combination of non-unique features
(a conjunction target) normally cannot be detected
preattentively. Fig. 3 shows an example of
conjunction search. The red circle target is made up of two features:
red and circular. One of these features is present in each of the
distractor objects (red squares and blue circles). This means the
visual system has no unique visual property to search for when trying
to locate the target. If a viewer searches for red items, the visual
system always returns true because there are red squares in each
display. Similarly, a search for circular items always sees blue
circles. Numerous studies have shown that this target cannot be
detected preattentively. Viewers must perform a time-consuming serial
search through the displays to confirm its presence or absence.
(a)
|
(b)
|
|
Fig. 3: An example of a conjunction search for a target red
circle: (a) target is absent in a sea of red square and
blue circle distractors; (b) target is present
|
The Javascript applet below will let
you experiment with the three different target detection searches:
colour, shape, and conjunction. As in the figures above, the target is
a red circle. Background elements are either blue circles (during
colour searches), red squares (during shape searches), or blue circles
and red squares (during conjunction searches). The "Exposure
Duration:" slider lets you control how long each display is shown
(anywhere from 100 to 1000 msec). The "Elements per
Display:" slider lets you control the total number of elements in
each display (from a minimum of 10 to a maximum of 70). The
"Number of Trials:" slider lets you control how many
displays to run.
After each display, the applet will tell you whether the target was
present or absent. This allows you to compare your answer with the
correct answer for each display you see.
If the low-level visual system can be harnessed during
visualization, it can be used to draw attention to areas of potential
interest in a display. This cannot be accomplished in an ad-hoc
fashion, however. The visual features assigned to different data
attributes (the data-feature mapping) must take advantage of
the strengths of our visual system, must be well-suited to the
analysis needs of the viewer, and must not produce that visual
interference effects (e.g., conjunction search) that could mask
information in a display.
Table 1 lists some of the visual features
that have been identified as preattentive. Experiments in psychology
have used these features to perform the following preattentive visual
tasks:
- target detection: users rapidly and accurately detect the
presence or absence of a "target" element with a unique
visual feature within a field of distractor elements
(Figs. 1, 2,
and 3),
- boundary detection: users rapidly and accurately detect a
texture boundary between two groups of elements, where all of the
elements in each group have a common visual property
(Fig. 4),
- region tracking: users track one or more elements with a
unique visual feature as they move in time and space, and
- counting and estimation: users count or estimate the number
of elements with a unique visual feature.
|
Table 1: A partial list of preattentive visual features,
together with references to research that showed they were
preattentive
|
Theories of Preattentive
Processing
A number of theories have been proposed to explain how preattentive
processing occurs within the visual system. We describe four
well-known models: feature integration
theory, texton
theory, similarity theory,
and guided search theory. We also discuss
briefly the phenomena of postattentive
vision, which shows that prior exposure to an scene does not help
a viewer answer questions about the content of the scene.
Feature Integration Theory
Anne Treisman was one of the original researchers to document the
area of preattentive processing. She provided important insight into
this phenomena by studying two important problems. First, she tried to
determine which visual properties are detected preattentively
[Treisman
91, Treisman & Gormican
88, Treisman & Souther 86]. She
called these properties "preattentive features"
[Treisman 85]. Second, she formulated a
hypothesis about how the human visual system performs preattentive
processing [Treisman & Gelade
80].
Treisman ran experiments using target and boundary detection to
classify preattentive features. For target detection, subjects had to
determine whether a target element was present or absent in a field of
background distractor elements (Figs. 1
and 2). Boundary detection involved placing a
group of target elements with a unique visual feature within a set of
distractors to see if the boundary could be preattentively detected
(Fig. 4).
Treisman and other researchers measured for preattentive task
performance in two different ways: by response time, and by
accuracy. In the response time model viewers are asked to complete the
task (e.g., target detection) as quickly as possible while
still maintaining a high level of accuracy. The number of distractors
in a scene is repeatedly increased. If task completion time is
relatively constant and below some chosen threshold, independent of
the number of distractors, the task is said to be preattentive. If the
task were not preattentive, viewers would need to search serially
through each display to confirm a target's presence or
absence. Increasing the number of elements in the display would
therefore produce a corresponding increase in the time required to
report on the target.
In the accuracy model the display is shown for a small, fixed
exposure duration, then removed from the screen. Again, the number of
distractors in the scene varies (i.e., increases) across
trials. If viewers can complete the task accurately, regardless of the
number of distractors, the feature used to define the target is
assumed to be preattentive. A common exposure duration threshold is
200 to 250 msec, since this allows subjects only "one look"
at the scene. The human visual system cannot decide to change where
the eye is looking within this time frame.
(a)
|
(b)
|
|
Fig. 4: An example of a boundary detection from Treisman's
experiments: (a) a boundary defined by a unique feature hue
(red circles and red squares on the top, blue circles and blue
squares on the bottom) is preattentively classified as
horizontal; (b) a boundary defined by a conjunction of
features (red circles and blue squares on the left, blue circles
and red squares on the right) cannot be preattentively
classified as vertical
|
Treisman and others have used their experiments to compile a list
of visual features that are detected preattentively
(Table 1). It is important to note that
some of these features are asymmetric. For example, a sloped line in a
sea of vertical lines can be detected preattentively. However, a
vertical line in a sea of sloped lines cannot be detected
preattentively. Another important consideration is the effect of
different types of background distractors on the target feature. These
factors must often be addressed when trying to design display
techniques that rely on preattentive processing.
In order to explain the phenomena of preattentive processing,
Treisman proposed a model low-level human vision made up of a set of
feature maps and a master map of locations. Each feature map registers
activity in response to a specific visual feature. Treisman suggested
a manageable number of feature maps, including one for each of the
opponent colour primaries green, red, yellow, and blue, as well as
separate maps for orientation, shape, texture, and other preattentive
features.
When the human visual system first sees an image, all the features
are encoded in parallel into their respective maps. A viewer can
access a particular map to check for activity, and perhaps to
determine the amount of activity. The individual feature maps give no
information about location, spatial arrangement, or relationships to
activity in other maps, however.
|
Fig. 5: Treisman's feature integration model for early vision;
individual maps can be accessed to detect feature activity;
focused attention acts through a serial scan of the master map
of locations
|
This framework provides a general hypothesis that explains how
preattentive processing occurs. If the target has a unique feature,
one can simply access the given feature map to see if any activity is
occurring. Feature maps are encoded in parallel, so feature detection
is almost instantaneous. A conjunction target cannot be detected by
accessing an individual feature map. Activity there may be caused by
the target, or by distractors that share the given preattentive
feature. In order to locate the target, one must search serially
through the master map of locations, looking for an object with the
correct combination of features. This use of focused attention
requires a relatively large amount of time and effort.
In later work, Treisman has expanded her strict dichotomy of
features being detected either in parallel or in serial
[Treisman
91, Treisman & Gormican
88]. She now believes that parallel and serial represent two ends
of a spectrum. "More" and "less" are also encoded
on this spectrum, not just "present" and
"absent". The amount of differentiation between the target
and the distractors for a given feature will affect search time. For
example, a long vertical line can be detected immediately among a
group of short vertical lines. As the length of the target shrinks,
the search time increases, because the target is harder to distinguish
from its distractors. At some point, the target line becomes shorter
than the distractors. If the length of the target continues to
decrease, search time decreases, because the degree of similarity
between the target and the distractors is now decreasing.
Treisman has also extended feature integration to explain certain
cases where conjunction search is preattentive. In particular,
conjunction search tasks involving motion, depth, colour, and
orientation have been shown to be preattentive by Nakayama and
Silverman [86], Driver et
al. [92], and Wolfe et
al. [89]. Treisman hypothesizes that a
significant target–nontarget feature difference would allow
individual feature maps to ignore nontarget information contained in
the master map. For example, consider a search for a green horizontal
bar within a set of red horizontal bars and green vertical bars. This
should result in conjunction search, since horizontal and green occur
within each of the distractors. In spite of this, Wolfe et
al. [89] showed that search times are
independent of display size. If colour constituted a significant
feature difference, the red colour map could inhibit information about
red horizontal bars. Thus, the search reduces to finding a green
horizontal bar in a sea of green vertical bars, which can be done
preattentively.
Texton Theory
Bela Julész was also instrumental in expanding our
understanding of what we "see" in an image. Julész's
initial investigations focused on statistical analysis of texture
patterns [Julész
71, Julész
75, Julész
81b, Julész et
al. 73, Julész et
al. 78]. His goal was to determine whether variations in a
particular order statistic were seen (or not seen) by the low-level
visual system. Examples of variations in order statistics include
contrast (a variation in a texture's first-order statistic),
orientation and regularity (a variation of the second-order
statistic), and curvature (a variation of the third-order
statistic). Unfortunately, Julész's results were
inconclusive. First-order variations were detected preattentively. In
addition, some (but not all) second-order variations were also
preattentive, as were an even smaller set of third-order
variations.
Based on these findings, Julész modified his theory of how
preattentive processing occurs. He suggested that the early visual
system detects a group of features called textons
[Julész
81a, Julész
81b, Julész & Bergen
84]. Textons can be classified into three general categories:
- Elongated blobs (e.g., line segments, rectangles, ellipses)
with specific properties such as hue, orientation, and width.
- Terminators (ends of line segments).
- Crossings of line segments.
Julész believed that only a difference in textons or in
their density can be detected preattentively. No positional
information about neighbouring textons is available without focused
attention. Like Treisman, Julész suggested that preattentive
processing occurs in parallel and focused attention occurs in
serial.
|
Fig. 6: An example of textons: (a,b) two textons (A and B) that
appear different in isolation, but have the same size, number of
terminators, and join points; (c) a target group of B-textons is
difficult to detect in a background of A-textons when a random
rotation is applied
|
Julész used texture segregation, the task of locating groups
of similar objects and the boundaries that separate them, to
demonstrate his theory (other researchers like Treisman also used this
type of task, for example, identifying the orientation of the boundary
between groups of common elements
in Fig. 4). Fig. 6 shows an
example of an image that supports the texton hypothesis. Although the
two objects look very different in isolation, they are actually the
same texton. Both are blobs with the same height and width. Both are
made up of the same set of line segments and each has two
terminators. When oriented randomly in an image, one cannot
preattentively detect the texture boundary between the target group
and the background distractors.
Similarity Theory
Some researchers do not support the dichotomy of serial and
parallel search modes. Initial work in this area was done by Quinlan
and Humphreys [87]. They investigated
conjunction searches by focusing on two factors. First, search time
may depend on the number of items of information required to identify
the target. Second, search time may depend on how easily a target can
be distinguished from its distractors, regardless of the presence of
unique preattentive features. Treisman addressed this second factor in
her later work [Treisman
88]. Quinlan and Humphreys found that Treisman's feature
integration theory was unable to explain the results they obtained
from their experiments. Duncan and Humphreys proceeded to develop
their own explanation of preattentive processing. Their model assumes
that search ability varies continuously, depending on both the type of
task and the display conditions [Duncan
89a, Duncan
89b, Müller 90]. Search time is
based on two criteria: T-N similarity and N-N similarity. T-N
similarity is the amount of similarity between the targets and
nontargets. N-N similarity is the amount of similarity within the
nontargets themselves. These two factors affect search time as
follows:
- as T-N similarity increases, search efficiency decreases and
search time increases,
- as N-N similarity decreases, search efficiency decreases and
search time increases, and
- T-N similarity and N-N similarity are related
(Fig. 7); decreasing N-N similarity has little
effect if T-N similarity is low; increasing T-N similarity has little
effect if N-N similarity is high.
(a)
|
|
(b)
|
|
Fig. 7: Example of N-N similarity affecting search efficiency
for a target shaped like the letter L: (a) high N-N
(nontarget-nontarget) similarity allows easy detection of target
L; (b) low N-N similarity increases the difficulty of detecting
the target L
|
Treisman's feature integration theory has difficulty explaining the
results of Fig. 7. In both cases, the distractors
seem to use exactly the same features as the target, namely oriented,
connected lines of a fixed length. Yet experimental results show
displays similar to Fig. 7a produce an average
search time increase of 4.5 msec per additional distractor, while
displays similar to Fig. 7b produce an average
search time increase of 54.5 msec per additional distractor. In order
to explain the above and other search phenomena, Duncan and Humphreys
proposed a three-step theory of visual selection.
- The visual field is segmented into structural units. Individual
structural units share some common property (e.g., spatial
proximity, hue, shape, motion). Each structural unit may again be
segmented into smaller units. This produces a hierarchical
representation of the visual field. Within the hierarchy, each
structural unit is described by a set of properties (e.g.,
spatial location, hue, texture, size). This segmentation process
occurs in parallel.
- Because access to visual short-term memory is limited, Duncan and
Humphreys assume that there exists a limited resource that is
allocated among structural units. Because vision is being directed to
search for particular information, a template of the information being
sought is available. Each structural unit is compared to this
template. The better the match, the more resources allocated to the
given structural unit relative to other units with a poorer match.
- Because units are grouped in a hierarchy, a poor match between the
template and a structural unit allows efficient rejection of other
units that are strongly grouped to the rejected unit.
Structural units with a relatively large number of resources have
the highest probability of access to the visual short-term
memory. Thus, structural units that most closely match the template of
information being sought are presented to the visual short-term memory
first. Search speed is a function of the speed of resource allocation
and the amount of competition for access to the visual short-term
memory
Given these three steps, we can see how T-N and N-N similarity
affect search efficiency. Increased T-N similarity means more
structural units match the template, so competition for visual
short-term memory access increases. Decreased N-N similarity means we
cannot efficiently reject large numbers of strongly grouped structural
units, so resource allocation time and search time increases.
Guided Search Theory
More recently, Jeremy Wolfe has suggested a visual search theory
that he calls "guided search"
[Wolfe
94, Wolfe & Cave
89, Wolfe et al. 89]. He
hypothesized that an activation map based on both bottom-up and
top-down information is constructed during visual search. Attention is
drawn to peaks in the activation map that represent areas in the image
with the largest combination of bottom-up and top-down influence.
As with Treisman, Wolfe believes early vision divides an image into
individual feature maps (Fig. 8). In his theory,
there is one map for each feature type (e.g., one map for
colour, one map for orientation, and so on). Within each map a feature
is filtered into multiple categories. For example, in the colour map
there might be independent representations for red, green, blue, and
yellow. Wolfe had already found evidence to suggest that orientation
is categorized into steep, shallow, right, and left
[Wolfe 92]. The relationship between
values within a feature map is different than the relationship between
values from different maps (i.e., the relationship between
"red" and "blue" is different than the
relationship between "blue" and "shallow").
Bottom-up activation follows feature categorization. It measures
how different an element is from its neighbours. Differences for each
relevant feature map are computed and combined (e.g., how
different are the elements in terms of colour, how different are they
in terms of orientation?) The "metrics" used to measure
differences in each feature map are still being investigated.
|
Fig. 8: Framework for guided search, user wants to find a green
steep target; image is filtered into categories for each feature
map, bottom-up and top-down activation "mark" regions
of the image; an activation map is built by combining bottom-up
and top-down information, attention is draw to the highest
"hills" in the map
|
Top-down activation is a user-driven attempt to find items with a
specific property or set of properties. For example, visual search for
a blue element would generate a top-down request that activates
"blue" locations. Previous work suggests subjects must
specify requests in terms of the categories provided by each feature
map [Wolfe & Franzel
88, Wolfe 92]. Thus, subjects could
search for "steep" or "shallow" elements, but not
for elements rotated by a specific angle. Obviously, subjects should
pick the category that best differentiates the target from its
distractors. Finding the "best" category is often
nonintuitive, however. Wolfe suggests this might explain cases where
subjects' performance for a task improves over time.
The activation map is a combination of bottom-up and top-down
activation. The weights assigned to these two values are task
dependent. A conjunction search would place priority on top-down
information, since bottom-up results are, in essence, useless. Search
for a target with a unique feature would assign a high weight to
bottom-up activation. Hills in the activation map mark regions that
generated a relatively large amount of bottom-up or top-down
influence. There is no information in the activation map about the
source of a hill. High activation from a colour map looks exactly the
same as high activation from an orientation map. A subject's attention
is drawn from hill to hill in order of decreasing activation.
Wolfe's theory easily explains traditional "parallel"
visual search. Target elements produce the highest level of
activation, regardless of the number of distractor elements. This
causes the target to "pop-out" of the scene in time
independent of the number of distractors. This also explains Duncan
and Humphreys' similarity theory results. Low N-N similarity causes
distractors to report higher bottom-up activation, since they now
differ from their neighbours. High T-N similarity causes a reduction
in the target elements' bottom-up activation. Moreover, guided search
also provides a possible explanation for situations where conjunction
search can be performed preattentively
[Nakayama & Silverman
86, Wolfe
89, Wolfe 90]. User-driven top-down
activation may permit efficient searching for conjunction targets.
Boolean Map Theory
A more recent model of low-level vision has been presented by Huang
et al. [Huang and Pashler
2007, Huang et al. 2007]. This
theory carefully divides a visual search task into two
parts: selection and access. Selection involves
choosing a set of objects from a scene. Access determines what
properties of the selected objects a viewer can apprehend. Although
both operations are implicitly present in previous theories, they are
often described as a whole and not as separate steps.
Huang et al. propose that the visual system is capable of dividing
a scene into exactly two parts: selected elements and excluded
elements. This is the "boolean map" that underlies their
theory. The visual system can then access certain properties of the
selected elements in the map.
|
Fig. 9: Boolean maps: (a) original scene with red and blue,
vertical and horizontal elements; (b) boolean map on selection
"red", colour label is red, orientation label is
undefined; (c) boolean map on selection "vertical",
orientation label is vertical, colour label is undefined; (d)
boolean map on selection "all locations", colour label
is undefined, orientation label is undefined
|
How are elements selected? That is, how is a boolean map created by
the visual system? One way is for a viewer to specify a single value
of an individual feature. All objects that contain the feature value
are then selected. For example, a viewer could look for red objects,
or vertical objects, or big objects. An important distinction between
feature integration and boolean maps is that, in feature integration,
presence or absence of a feature is available preattentively, but no
information on location is provided. A boolean map, on the other hand,
encodes the specific spatial locations of the elements that are
selected.The boolean map contains feature labels to define properties
of the selected objects. If, for example, a viewer selected red
objects (Fig. 9b), the colour feature label for
the resulting boolean map would be "red". Labels for other
features (e.g. orientation, size) would be undefined, since they have
not (yet) participated in the creation of the map.
A second method of selection is for a viewer to choose a set of
elements at specific spatial locations. In this scenario, the boolean
map would provide information about the spatial layout of the selected
objects, but all feature labels would be undefined, since no specific
feature value was used to identify the selected
elements. Fig. 9 shows an example of a simple
scene, and the resulting boolean maps for selecting red objects,
selecting vertical objects, or selecting all locations.
Once a boolean map is available, what information can a viewer
access? Two properties of a boolean map are available to a viewer: the
label for any feature in the map, and the spatial location of the
selected elements. For example, in Fig. 9b where
red objects have been created, a viewer can access colour of any
object as red, and can also identify the spatial locations of the
selected objects. A viewer cannot, however, determine the orientation
of a particular object in the map, because the orientation label is
undefined. In order to locate, for example, vertical objects, a new
boolean map based on this feature value must be created.
|
Fig. 10: Set operations on boolean maps: (a) original scene with
red and blue, vertical and horizontal elements; (b) boolean map
on selection "red", colour label is "red",
orientation label is undefined; (c) boolean map on selection
"vertical", orientation label is "vertical",
colour label is undefined; (d) boolean map from intersection of
"red" and "vertical" maps, colour label is
red, orientation label is vertical
|
A second way that a boolean map can be created is by applying set
operators union and intersection on two existing maps
(Fig. 10). For example, a viewer could create an
initial map by specifying the colour feature value red
(Fig. 10b). The viewer could then create a
second map by specifying the orientation vertical
(Fig. 10c), and intersect this map with the one
currently held in memory. The result is a boolean map identify the
locations of red, vertical objects
(Fig. 10d). In this map, the colour label would
be "red", and the orientation label would be
"vertical". Note that a viewer can only hold and access one
boolean map at any given time. The result of the set operation
immediately replaces the viewer's current map. In this way, a viewer
can search for composite objects (e.g. red, vertical objects) by
applying a series of boolean map operations.
The boolean map model leads to some suprising and counterintuitive
expectations, relative to existing preattentive models. For example,
consider search for a conjunction target that is blue and horizontal
in a sea of red horizontal and blue vertical objects. Theories like
feature intergration and guided search dictate that this type of
search is difficult, and the time required to find a target is
proportional to the number of objects in the scene because search
inspection is required. The boolean map theory says this type of
combined feature search is more difficult that single feature search,
because it requires two boolean map operations in series: creating a
blue map, then creating a horizontal map and intersecting it against
the current (blue) map to hunt for the target. Importantly, however,
boolean map theory says that the time required for such a search is
constant and independent of the number of objects in the display. The
time to search for the target is simply the sum of the time required
to complete the two boolean map operations.
|
Fig. 11: Conjunction search using a boolean map strategy: (a-b)
blue horizontal target, select "blue" objects first,
then search within for a horizontal target, target present in
(a), absent in (b); (c-d) a red vertical target, select
"red" objects first, then search within for a vertical
target, target absent in (c), present in (d)
|
Consider Fig. 11, which includes two
conjunction targets, a blue horizontal object
(Fig. 11a-b) and a red vertical object
(Fig. 11c-d). Apply the following strategy to
search for the target. In Fig. 11a-b, first
search for blue objects, and once you have these "held" in
your memory, look for the horizontal object within that group. For
most observers it is not difficult to determine the target is present
in Fig. 11a and absent
in Fig. 11b when such a strategy is applied. A
similiar search can be used to locate the red vertical target
in Fig. 11c-d.
|
Fig. 12: Colour symmetry mismatch search: (a) two mismatches
involving all four colours, one blue-green switch, one
red-yellow switch; (b) two mismatches involving only two
colours, two red-green switches
|
Another task that illustrates the boolean map theory is identifying
differences in colour
symmetry. Consider Fig. 12, where pairs of
16-element blocks are displayed with four colours: red, green, blue,
and yellow. In each figure, there are two mismatched squares between
the left and the right block. Fig. 12a's
mismatches involve all four colours: one blue-green switch and one
red-yellow switch. In Fig. 12b, however, the
mismatches involve only two colours: two red-green switches. Boolean
map theory says locating a mismatch in Fig. 12a
will be, on average, faster than
in Fig. 12b. This is because
in Fig. 12a, no matter which colour value the
viewer chooses to select on, a mismatch will always be present between
the boolean maps. In Fig. 12b, only two colour values (red and green)
will build maps that contain a mismatch. Viewer can confirm this for
themselves. In Fig. 12a, focus on one of red,
green, blue, or yellow. Notice that no matter which colour you choose,
a mismatch will always be immediately visible between the two
blocks. If you perform the same exercise
on Fig. 12b, two boolean maps (red and green)
contain a mismatch, but two boolean maps (blue and yellow) do not. It
is therefore random whether the first maps selected
in Fig. 12b contains mismatch, and therefore it
should take, on average, 1.67 times longer to identify colour symmetry
mismatches versus Fig. 12a.
Postattentive Vision
Preattentive processing asks in part: "What visual properties
draw our eyes, and therefore our focus of attention to a particular
object in a scene?" An equally interesting question is:
"What happens to the visual representation of an object when we
stop attending to it and look at something else?" Jeremy Wolfe
addressed this question in his work on postattentive vision
[Wolfe et al. 2000]. The intuitive
belief that a rich visual representation accumulates as we look at
more and more of a scene appears not to be true. This provides
important insight into why the low-level visual system performs the
way it does. The results also act as a bridge between preattentive
processing and the new area of change blindness, which shows that
people are often "blind" to significant variations that
occur between glances at a scene.
Attention to different objects may allow a viewer to learn what is
in a scene (if the objects are familiar and recognizable), but it does
not allow the viewer to see the scene in a different manner. In other
words, the preattentive visual representation of an
object after a viewer studies it and looks at something else
appears to be identical to its representation before the viewer
studied it. No additional information is "saved" in the
visual system after the focus of attention shifts to a new
location.
Wolfe argues that if multiple objects are recognized simultaneously
in the low-level visual system, it would involve a search for links
between the objects and their representation in long-term memory
(LTM). LTM can be queried nearly instantaneously, compared to the
40-50 msec per item required to search a visual scene or to access
short-term memory. Preattentive processing can help to rapidly draw
the focus of attention to a target with a unique visual feature
(i.e., little or no searching is required in the preattentive
case). To remove this assistance, Wolfe designed targets with two
critical properties (Fig. 13):
- The targets were formed from a conjunction of features (i.e., they could not be detected preattentively).
- The targets were arbitrary combinations of colours and shapes
(i.e., they were not objects that could be semantically
recognized and remembered on the basis of familiarity).
(a)
|
(b)
|
|
Fig. 13: Examples of search for color-and-shape conjunction
targets, both with and without a preview of the scene: (a) no
preview of the scene is shown (although text identifying the
target is shown prior to the search), in this case the green
vertical target is present; (b) a preview of the scene is shown,
followed by text identifying the target, in this case a white
oblique target is not present
|
Wolfe initially tested two search types. In both cases, viewers
were asked to answer as quickly as possible while maintaining a high
level of accuracy (i.e., a response time search):
- Traditional search. Text on a blank screen was shown to
identify the target. This was followed by a display containing 4, 5,
6, 7, or 8 potential target objects in a 3-by-3 array (formed by
combinations of seven colours and five
shapes, Fig. 13a).
- Postattentive search. The display to be searched was shown
to the user for a specific duration (up to 300 milliseconds). Text
identifying the target was then inserted into the scene
(Fig. 13b).
Results showed that the postattentive search was as slow (or
slower) than the traditional search, with approximately 25-40 msec per
object required for the target present trials. This implies that
previewing the scene provides no advantage to the viewer for finding a
conjunction target. In order to explore further, Wolfe studied a
number of different search scenarios to test for any benefit from
previewing the scene:
- Repeated search: viewers were asked to search the same
display five times for five different targets. The display was shown
with target text, and after an answer was provided (target present or
absent), the target text changed to identify a new target. This
experiment tested whether additional exposure to the display improved
search performance.
- Repeated search with letters: viewers searched in a manner
identical to repeated search, but with displays containing letters
rather than combinations of colours and shapes. This experiment tested
whether the type of target used affected search performance.
- Repeated search versus memory search: viewers were asked to
search a group of five letters 350 times for a target letter. Half the
viewers were shown the five letters. The other half were required to
memorize the five letters prior to the target queries. This experiment
tested whether a prolonged exposure to a set of objects improved
search performance. It also tested to see how visual search and
short-term memory search performance differed.
In each case viewers continued to require 20-50 msec per object to
complete the search. Wolfe's conclusion was that sustained attention
to the objects tested in his experiments did not make visual search
more efficient. This has a significant potential impact for
visualization design. In most cases, visualization displays are novel,
and their contents cannot be committed to long-term memory. This means
that studying a display may offer no assistance in searching for
specific data values. In this scenario, methods that draw attention to
areas of potential interest within a display (i.e.,
preattentive methods) would be critical in allowing viewers to rapidly
and accurate explore their data.
Feature Hierarchy
Based on our understanding of low-level human vision, one promising
strategy for multidimensional visualization is to assign different
visual features to different data attributes (i.e., building
a data-feature mapping that maps data to a visual
representation). This allows multiple data values to be shown
simultaneously in a single image. One key requirement of this method
is a data-feature mapping that does not produce visual
interference. Interactions between different visual features hide or
mask information in a display. Obviously, we want to avoid this
situation during visualization. One simple example of visual
interference is the conjunction search shown
in Fig. 3. If we want to search rapidly for
combinations of data values, care must be taken to ensure the
resulting combinations contain at least one unique feature for the
visual system to cue on.
Other types of visual interference can also occur. An important
type of interference results from a feature hierarchy that
appears to exist in the visual system. For certain tasks the visual
system seems to favour one type of visual feature over another. For
example, during boundary detection researchers have shown that the
visual system favours colour over shape
(Fig. 14). Background variations in colour
interfere with a viewer's ability to identify the presence of
individual shapes and the spatial patterns they form
[Callaghan 90]. If colour is held
constant across the display, these same shape patterns are immediately
visible. The interference is asymmetric: random variations in shape
have no effect on a viewer's ability to see colour patterns.
|
Fig. 14: An example of hue-on-form feature hierarchy: (a) a
horizontal hue boundary is preattentive identified when form is
held constant; (b) a vertical hue boundary is preattentively
identified when form varies randomly in the background; (c) a
vertical form boundary is preattentively identified when hue is
held constant; (d) a horizontal form boundary cannot be
preattentively identified when hue varies randomly in the
background
|
Callaghan also documented a luminance-on-hue preference during her
experiments [Callaghan
84, Callaghan 89]. More recently, a
hue-on-texture interference has been shown to exist
[Healey & Enns
98, Healey & Enns
99, Snowden
98, Treisman 85]; random variations in
hue interfere with the identification of texture patterns, but not
vice-versa. These hierarchies suggest the most important data
attributes (as defined by the viewer) should be displayed with the
most salient visual features, if possible. The data-feature mapping
should avoid situations where the display of secondary data values
masks the information the viewer wants to see.
The Javascript applet below will
let you experiment with the two different boundary identifications:
colour and shape. As in Fig. 14, the boundary is
either horizontal or vertical, defined by either colour or shape. The
"Interference" checkbox enables interference; for colour
boundaries, this means that the brightness of each element varies
randomly, for shape boundaries the colour varies randomly. The
"Exposure Duration:" slider lets you control how long each
display is shown (anywhere from 100 to 1000 msec). The "Number of
Trials:" slider lets you control how many displays you want to
try. After each display, the applet will tell you whether the boundary
was horizontal or vertical. This allows you to compare your answer
with the correct answer for each display you see.
Change Blindness
Recent research in visualization has explored ways to apply rules
of perception to produce images that are visually salient
[Ware 2000]. This work is based in large part
on psychophysical studies of the low-level human visual system. One of
the most important lessons of the past twenty-five years is that human
vision does not resemble the relatively faithful and largely passive
process of modern photography [Pomerantz
& Pristach 89, Treisman
85, Treisman &
Gormican, Wolfe
94, Wolfe et al. 2000]. The goal
of human vision is not to create a replica or image of the seen world
in our heads. A much better metaphor for vision is that of a dynamic
and ongoing construction project, where the products being built are
short-lived models of the external world that are specifically
designed for the current visually guided tasks of the viewer
[Egeth & Yantis
97, Mack & Rock
98, Rensink
2000, Simons 2000]. There does not
appear to be any general purpose vision. What we "see" when
confronted with a new scene depends as much on our goals and
expectations as it does on the array of light that enters our
eyes.
These new findings differ from one of the initial ideas of
preattentive processing, that only certain features in an image are
recognized without the need for focused attention, and that other
features cannot be detected, even when viewers actively search
for these exact features. More recent work in preattentive vision has
presented evidence to suggest that this strict dichotomy does not
hold. Instead, "visible" or "not visible"
represent two ends of a continuous spectrum. Issues like the
difference between a target's visual features and its neighbours'
features, what a viewer is searching for, and how the image is
presented can all have an effect on search performance. For example,
Wolfe's guided search theory assumes both bottom-up (i.e.,
preattentive) and top-down (i.e., attention-based) activation
of features in an image [Wolfe & Cave
89, Wolfe et
al. 89, Wolfe 94]. Other
researchers like Treisman have also studied the dual effects of
preattentive and attention-driven demands on what the visual system
sees [Treisman
91, Treisman & Souther
86]. Wolfe's discussion of postattentive vision also points to the
fact that details of an image cannot be remembered across separate
scenes except in areas where viewers have focused their attention
[Wolfe et al. 2000].
New research in psychophysics has shown that an interruption in
what is being seen (e.g., a blink, an eye saccade, or a blank
screen) renders us "blind" to significant changes that occur
in the scene during the interruption. This change blindness
phenomena can be illustrated using a task similar to a game that has
amused children reading the comic strips for many years
[Rensink 97, Mack
& Rock 98, Rensink
2000, Simons
2000]. Fig. 15 contains ten Quicktime movies
that loop over and over; each movie is made up of two separate images
with a short blank interval separating them. A significant change
occurs between the two images. Run the movies and try to locate the
change. Many viewers have a difficult time seeing any difference and
often have to be coached to look carefully to find it. Once they
discover it, they realize that the difference was not a subtle
one. Change blindness is not a failure to see because of limited
visual acuity; rather, it is a failure based on inappropriate
attentional guidance. Some parts of the eye and the brain are clearly
responding differently to the two pictures. Yet, this does not become
part of our visual experience until attention is focused directly on
the objects that vary.
The presence of change blindness in our visual system has important
implications for visualization. The images we produce are normally
novel for our viewers, so prior expectations cannot be used to guide
their analyses. Instead, we strive to direct the eye, and therefore
the mind, to areas of interest or importance within a
visualization. This ability forms the first step towards enabling a
viewer to abtract details that will persist over subsequent
images.
Dan Simons offers a wonderful overview of change blindness in his
introduction to the Visual Cognition special issue on change blindness
and visual memory [Simons 2000]. We
provide a brief summary of his list of possible explanations for why
change blindness occurs in our visual system. Interestingly, none of
these explanations by themselves can account for all of the change
blindness effects that have been identified. This suggests that some
combination of these ideas (or some completely different hypothesis)
is needed to properly model this phenomena.
|
Fig. 15: Examples of change blindness, each image sequence
contains a significant variation across its two frames; click on
the image to view the image sequence as a Quicktime movie (or
choose GIF to view an animated GIF); all sequences courtesy
of Ron Rensink,
see his
discussion
of change blindness for additional resources
|
Overwriting
One intuitive suggestion is that the current image is overwritten,
either by the blank between images, or by the image seen after the
blank. Information that was not abstracted from the first image is
lost. In this scenario, detailed change can only be detected for
objects the viewer focuses on, and even then, only abstract
differences may be recognized.
First Impression
A second hypothesis is that only the initial view of a scene is
abstracted. This is plausible, since the purpose of perception is to
rapidly understand our surroundings. Once this is done, if the scene
is not perceived to have changed, features of the scene should not
need to be re-encoded. This means that change will not be detected
except for objects in the focus of attention. One example of this
phenomena is an experiment conducted by Levins and Simon
[Levins & Simon
97, Simon 96]. Subjects were asked
to view a short movie. During a cut scene in the movie, the central
character was switched to a completely different actor. Subjects were
not told to search for any unexpected change in the movie
(i.e., they were naïve to the presence of the
change). After viewing the movie, subjects were asked if they noticed
anything odd. Nearly two-thirds of the subjects failed to report that
the main actor was replaced. When queried, 70% of the subjects who
failed to see the change described the central character using details
from the initial actor, and not the replacement. This suggests that
their first impression of the actors was the lasting one.
Nothing is Stored
A third explanation is that after a scene has been viewed and
information has been abstracted, no details are represented
internally. This model suggests that the world itself acts as a memory
store; if we need to obtain specific details from the scene, we simply
look at it again. A somewhat weaker form of this model suggests that
some detail is preserved between scenes (e.g., the details of
the objects in the viewer's focus of attention). In this way, we are
blind to change unless it affects our abstracted knowledge of the
scene, or unless it occurs where we are looking in the scene.
Everything is Stored, Nothing is Compared
Another intriguing possibility is that details about each new scene
are stored, but cannot be accessed until an external stimulus forces
the access. For example, if a man suddenly became a woman during a
sequence of images, this discontinuity in abstracted knowledge might
allow us to access the details of past scenes to detect the
change. Alternatively, being queried about particular details in a
past scene might also produce the stimulus needed to access this image
history. In one study, an experimenter stops a pedestrian on the
street to ask for directions [Simons
2000]. During this interaction, a group of students walks between
the experimenter and the pedestrian. As they do this, one of the
students takes a basketball the experimenter is holding. After
providing the directions, the pedestrian is asked if anything odd or
unusual changed about the experimenter's appearance. Only a very few
pedestrians reported that the basketball had gone missing. When asked
specifically about a basketball, however, more than half of the
remaining subjects reported it missing, and many provided a detailed
description. For example, one pedestrian reported, "Oh yeah, he
did have a ball, it was red and white." Not only was the
pedestrian able to recall the presence of the basketball when
prompted, he was also able to provide specific details about its
unique appearance.
Feature Combination
A final hypothesis is that details from an initial view might be
combined with new features from a second view to form a combined
representation of the scene. Presumably, viewers would not be aware of
which parts of their mental image come from the first scene, and which
come from the second. The details being combined must make sense, and
must be consistent with the viewer's abstract understanding of the
scene, otherwise the change will be recognized "impossible"
or "out of place".
More Recent Hypotheses
Simons and Rensink [Simons &
Rensink, 2005] recently revisited the area of change
blindness. They summarize much of the work-to-date, and describe
important research issues that are now being studied using change
blindness experiments. For example, evidence shows that attention is
required to detect changes, although attention alone is not
necessarily sufficient [Triesch et
al. 2003]. Changes to attended objects can also be missed,
particularly when the changes are unexpected. Changes to semantically
important objects are detected faster than changes elsewhere
[Rensink 97]. Low-level object
properties of the same kind (e.g. colour, shape, etc.) appear to
compete for recognition in visual short-term memory, but different
properties seem to be encoded separately and in parallel
[Wheeler and Triesman, 2002] (similar
in some ways to Triesman's
original feature integration theory
[Triesman & Gelade 80]). Finally,
experiments suggest the locus of attention is distributed
symmetrically around a viewer's fixation point
[Tse et al. 2003].
Simons and Rensink also described hypotheses that they felt are not
supported by existing research. For example, many people have used
change blindness to suggest that our visual representation of a scene
is sparse, or altogether absent. Simons and Rensink present four
hypothetical models of vision that include detailed representations of
a scene, while still allowing for change blindness. A detailed
representation could rapidly decay, making it unavailable for future
comparisons; a representation could exist in a pathway that is not
accessible to the comparison operation; a representation could exist
and be accessible, but not be in a format that supports the comparison
operation; or finally an appropriate representation could exist, but
the comparison operation is not applied even though it could
be. Simons and Rensink claim that, at the time of their article, these
possibilities have not been conclusively ruled out, and therefore no
conclusions about the sparseness of detail of our visual
representations can be made.
Simons and Rensink conclude with a short list of areas for future
research in change blindness:
- Can observers detect a change even if they fail to perceive it
consciously (in other words. does a "gut instinct" exist for
change in a scene)?
- How detailed are our visual representations?
- Can observers experience change before they can explicitly
localize and identify it?
- How do long-term memory representations contribute to change
detection?
Many of these issues are now being studied in the psychophysics and
vision communities.
Perception in Visualization
|
Fig. 16: Examples of perceptually-motivated multidimensional
visualizations:
(a) a
visualization of intelligent agents competing in simulated
e-commerce auctions, x-axis mapped to time, y-axis
mapped to auction (each row represents a separate auction),
towers represent bids by different agents with colour mapped to
agent ID, height mapped to bid price, and width mapped to bid
quantity;
(b) a
visualization of a CT scan of an abdominal aortic aneurism,
yellow represents the artery, purple represents the aneurism,
red represents metal tynes in a set of stents inserted into the
artery to support its wall within the aneurism;
(c) a
painterly visualization of weather conditions over the Rocky
Mountains across Utah, Wyoming, and Colorado, temperature mapped
to colour (dark blues for cold to bright pinks for hot),
precipitation mapped to orientation (tilting right for heavier
rainfall), wind speed mapped to coverage (less background
showing through for stronger winds), and size mapped to pressure
(larger strokes for higher pressure)
|
We conclude with some brief descriptions of how perceptual
properties of colour, texture, motion, and nonphotorealism have been
used in visualization.
Color
Color is a common feature used in many visualization
designs. Examples of simple color scales include the rainbow spectrum,
red-blue or red-green ramps, and the grey-red saturation scale
[Ware 88]. More sophisticated techniques
attempt to control the difference viewers perceive between different
colors, as opposed to the distance between their positions in RGB
space. This improvement allows:
- perceptual balance: a unit step anywhere along the color scale produces a perceptually uniform difference in color,
- distinguishability: within a discrete collection of colors,
every color is equally distinguishable from all the others
(i.e., no specific color is "easier" or
"harder" to identify), and
- flexibility: colors can be selected from any part of color
space (e.g., the selection technique is not restricted to only
greens, or only reds and blues).
Color models like CIE LUV, CIE Lab, or Munsell can be
used to provide a rough measure of perceptual balance
[Birren 69, CIE
76, Munsell 05]. Within these models,
Euclidean distance is used to estimate perceived color
difference. More complex techniques refine this basic idea. Rheingans
and Tebbs plotted a path through a perceptually balanced color model,
then asked viewers to define how attribute values map to positions
along the path [Rheingans & Tebbs
90]. Non-linear mappings emphasize differences in specific parts
of an attribute's domain (e.g., in the lower end with a
logarithmic mapping, or in the higher end with an exponential
mapping). Other researchers have constructed rules to automatically
select a colormap for a target data attribute
[Bergman 95, Rogowitz
& Treinish 93]. Properties of the attribute like its spatial
frequency, its continuous or discrete nature, and the type of analysis
to be performed are used to choose an appropriate color
representation. Ware constructed a color scale that spirals up around
the luminance axis to maintain a uniform simultaneous contrast error
along its length [Ware 88]. His solution
matched or outperformed traditional color scales for metric and form
identification tasks. Healey and Enns showed that color distance,
linear separation, and color category must all be controlled to select
discrete collections of equally distinguishable colors
[Healey 96, Healey
& Enns 99].

(a)
|
(b)
|
|
Fig. 17: Historical weather conditions over the eastern United
States for March, colour mapped to temperature (blue and green
for cold to red and pink for hot), luminance mapped to wind
speed (brighter for stronger winds), orientation mapped to
precipitation (more tilted for heavier rainfall), size mapped to
cloud coverage (larger for more cloudy), frost frequency mapped
to density (denser for higher frost): (a) a
nonphotorealistic visualization using simulated brush strokes to
display the underlying data; (b) a traditional visualization of
the same data using triangular glyphs
|
Our color selection technique combines different aspects of each of
these methods. A single loop spiraling up around
the L–axis (the luminance pole) is plotted near the
boundary of our monitor's gamut of displayable colors in CIE LUV
space. The path is subdivided into r named color regions
(i.e., a blue region, a green region, and so on). n
colors can then be selected by choosing n/r colors
uniformly spaced along each of the r color regions. The result
is a set of colors selected from a perceptually balanced color model,
each with a roughly constant simultaneous contrast error, and chosen
such that color distance and linear separation are constant within
each named color region (Fig. 17).
Texture
Texture is often viewed as a single visual feature. Like color,
however, it can be decomposed into a collection of fundamental
perceptual dimensions. Researchers in computer vision have used
properties like regularity, directionality, contrast, size, and
coarseness to perform automatic texture segmentation and
classification [Haralick et
al. 73, Rao & Lohse
93a, Rao & Lohse
93b, Tamura 78]. These texture features
were derived both from statistical analysis, and through experimental
study. Results from psychophysics have shown that many of these
properties are also detected by the low-level visual system, although
not always in ways that are identical to computer-based algorithms
[Aks & Enns
96, Cutting & Millard
84, Julész
75, Julész
84, Julész
73, Julész
78, Snowden
98, Treisman
91, Wolfe 94].
One promising approach in visualization has been to use perceptual
texture dimensions to represent multiple data attributes. Individual
values of an attribute control its corresponding texture
dimension. The result is a texture pattern that changes its visual
appearance based on data in the underlying dataset. Grinstein et
al. visualized multidimensional data with "stick-man" icons
whose limbs encode attribute values stored in a data element
[Grinstein 89]; when the stick-men are
arrayed across a display, they form texture patterns whose spatial
groupings and boundaries identify attribute correspondence. Ware and
Knight designed Gabor filters that modified their orientation, size,
and contrast based on the values of three independent data attributes
[Ware & Knight 95]. Healey and Enns
constructed perceptual texture elements (or pexels) that varied in
size, density, and regularity [Healey & Enns
98, Healey & Enns 99]; results
showed that size and density are perceptually salient, but variations
in regularity are much more difficult to identify. More recent work
found that 2D orientation can also be used to encode information
[Weigle 2000]; a difference of 15º is
sufficient to rapidly distinguish elements from one another. A
follow-on to these studies showed that certain 3D orientation
properties can also be detected by the low-level visual system
[Liu et al. 2003].
|
Fig. 18: Examples of a natural brick texture applied to an
underlying 3D object, oriented to follow different properties of
the surface at a per-pixel level: (a) orientation follows a
default "up" direction; (b) orientation follows the
first principle direction; (c) orientation follows the second
principle direction; all images courtesy
of Victoria
Interrante, see her discussion of
texture
synthesis for 3D shape perception for more
information
|
Recent work by Interrante, Kim, and Hagh-Shenas has studied the use
of different texture types and orientations for showing the shape of
an underlying 3D object. Initial experiments investigated textures
that varied in luminance (i.e., greyscale patterns)
[Interrante & Kim
2001, Interrante et
al. 2002, Kim et al. 2003]. More
recent work has studied the use of relief textures (e.g., the
brick pattern shown in Fig. 18). The textures
were arrayed over the surface using orientations that were either
isotropic (i.e., all following a common
direction, Fig. 18a), or anisotropic
(i.e., following different directions based on a property at
that point on the surface, Fig. 18b,
18c). Preliminary results suggest anisotropic textures that follow
both the first or second principle curvature directions produce
surface perception that is as good or better than either principle
direction alone, or than other orientation rules
[Kim et al. 2003].
Motion
Motion is a third visual feature that is known to be perceptually
salient. The use of motion is common in certain areas of
visualization, for example, the animation of particles, dye, or glyphs
to represent the direction and magnitude of a vector field
(e.g., fluid flow visualization). Motion transients are also
used to highlight changes in a dataset across a user-selected data
axis (e.g., over time for a temporal dataset, or along the
scanning axis for a set of CT or MRI slices). As with color and
texture, our interest is in identifying the perceptual dimensions of
motion and applying them in an effective manner. Three motion
properties have been studied extensively by researchers in
psychophysics: flicker, direction of motion, and velocity of
motion.
For visualization purposes, our interest is in flicker
frequencies F (the frequency of repetition measured in cycles
per second) that are perceived as discrete flashes by the
viewer. Brown noted that frequency must vary from 2-5% to produce a
distinguishable difference in flicker at the center of focus (1.02
≤ ΔF ≤ 1.05), and at 100% or more for
distinguishable difference in flicker in the periphery (ΔF ≥
2.0) [Brown
65, Gebb et
a. 55, Mowbray & Gebhard
55]. Tynan and Sekuler showed that a decrease in a target object's
velocity or an increase in its eccentricity increased identification
time [Tynan & Sekuler 82], although in
all cases viewers responded rapidly (200-350 milliseconds for targets
in the periphery, 200-310 milliseconds for targets in the center of
focus). van Doorn and Koenderink confirmed that higher initial
velocities produce a faster response to a change in the velocity
[Hohnsbein & Mateeff
98, Mateeff et
al. 95, van Doorn & Koenderink
82a, van Doorn & Koenderink
82b]. They claim this is due to the need for the target to
traverse a "critical distance" before it can be
detected. For a baseline velocity V1 and a target
velocity V2 = 2V1, approximately
100 milliseconds is needed to see the velocity change
from V1 to V2 for
slow V1 (1° per second) and approximately 50
milliseconds for faster V1 (2° per second or
higher).
Researchers in psychology have used properties of motion to extend
a viewer's ability to perform basic exploration tasks. Nakayama and
Silverman showed that coherent motion or stereoscopic depth can be
used to separate elements into coherent groups
[Nakayama & Silverman 86], allowing
viewers to search each group independently. For example, consider
searching for a red circle in a background of red squares and blue
circles, a situation that normally produces a time-consuming serial
search for the target (Fig. 3). If the red
elements are animated to move up and the blue elements are animated to
move down, however, the target is immediately visible. Applying
different motion patterns to the red and blue groups allows a viewer's
visual system to separate them and search them independently,
producing the rapid search for a curved element (a red circle) in a
background of linear elements (red squares). Similar results can be
achieved by displaying the red and blue elements on different
stereoscopic planes. Driver et al. showed that oscillation can also be
used to separate elements into independent visual groups, but only if
the oscillation pattern is coherent [Driver et
al. 92]. For example, a viewer could identify a red circle in a
set of red squares and blue circles if all the red items oscillate up
and down in lock step, and all the blue elements oscillate left and
right in lock step. If the elements oscillate "out of
phase", however (i.e., some red elements start moving down
while others are still moving up), viewers are forced to revert to
serial search. More sophisticated motion patterns have also been
analyzed, although with less success in terms of achieving high-speed
search performance. Braddick and Holliday studied both divergence
(e.g., squares increase or decrease in size over a period of
time, then snap back to their original size) and deformation
(e.g., rectangles deform from tall and skinny to short and
wide, then snap back to their original shape)
[Braddick & Holliday 1987]. Although
the basic motion properties being shown can be rapidly identified in
isolation, the combinations that form deformation and divergence were
not detected by the low-level low-level visual system.
|
Fig. 19: An example of
motion (animation) used to visualize location and membership
of elements common across two queries into an underlying data
source (click on the image to view a Quicktime movie of the
animation sequence)
|
Properties of motion have been extended to visualization
design. Animated motion is used in flow visualization to show the
direction and speed of different flow patterns (e.g., by Kirby
[Kirby et al. 1999]). Kerlick proposed the
use of animated glyphs to visualize 2D and 3D multidimensional
datasets [Kerlick 1990]. He designed a set
of "boids" to encode attribute values at specific locations
in the dataset, for example, a sphere boid to query data values at a
user-selected location, or pyramid and dart boids that animate over a
vector field to visualize its shape. Bartram et al. studied the use of
variations in color, shape, and motion to "notify" viewers
while they were engaged in a separate, attention-demanding task
[Bartram et al. 2002]. Results showed
that applying motion to a static glyph was significantly easier to
recognized, compared to changing the glyph's color or shape. This
finding held both when the glyph was near the center of focus, and
when it was located on the periphery of the viewer's gaze. The authors
also studied how distracting a secondary motion cue was judged to
be. Flicker was the least distracting, followed by oscillating motion,
then divergence, and finally movement over long distances. Related
work by Bartram et al. confirmed that different motion paths can be
used to perceptually group glyphs in a manner similar to the work of
Nakayama and Silverman or Driver et
al. [Bartram et al. 2003]. The groups
can then be searched independently for a target feature.
Nonphotorealism
For many years researchers in the areas of modeling and rendering
in computer graphics have studied the problem of producing
photorealistic images, images of graphical models that are
indistinguishable from photographs of an equivalent real-world
scene. Advances in areas such as the simulation of global light
transport, modeling of natural phenomena, and image-based rendering
have made dramatic strides towards achieving this goal. At the same
time, researchers have approached the issue of image generation from a
completely different direction. Although photographs are common, there
are many other compelling methods of visual discourse, for example,
oil and watercolor paintings, pen and ink sketches, cel animation, and
line art. In certain situations, these nonphotorealistic
renderings are often considered more effective, more appropriate,
or even more expressive than an equivalent photograph
[Gooch & Gooch
2001, Strothotte & Schlechtweg
2002].
|
Fig. 20: Examples of nonphotorealistic enhancements for volume
illustration: (a) original greyscale image of an abdominal CT
scan; (b) the same image with tone enhancement applied; (c) with
volumetric boundary sketching; (d) original colour image of the
same abdominal CT scan; (e) with halos and boundary and
silhouette enhancement; (f) with tone shading and boundary and
silhouette enhancement; all images courtesy
of Penny
Rheingans, see her discussion
of volume
illustration for more information
|
More recently, researchers in scientific visualization have started
to investigate how techniques from nonphotorealistic rendering might
be used to improve the expressiveness of a data display. Laidlaw
extended the layered approach of Meier
[Meier 96] to visualize
multidimensional data in a painterly fashion
[Kirby et
al. 1999, Laidlaw
2001, Laidlaw et al. 1998]. He varied
style properties such as underpainting lightness and stroke size,
transparency, direction, saturation, and frequency to display multiple
layers of information in a single nonphotorealistic image. Interrante
discussed constructing natural textures to visualize multidimensional
data [Interrante 2000]. Ebert and
Rheingans used nonphotorealistic techniques such as silhouettes,
sketch lines, and halos to highlight important features in a
volumetric dataset [Ebert & Rheingans
2000, Rheingans & Ebert 2001]
(Fig. 20). Follow-on work applied stipple
drawing techniques to interactively preview scientific and medical
volumes [Lu et al. 2002]. Finally, research
in our laboratory has identified a correspondence between image
features detected by the low-level visual system and brush stroke
properties employed by Impressionist masters during construction of
their paintings [Healey et al. 2004]
(Fig. 17). We exploit this correspondence to try
to construct visualizations that are both effective and aesthetic.
Bibliography
- Aks,
D. J. and Enns, J. T. Visual search for size is influenced by a
background texture gradient. Journal of Experimental Psychology:
Human Perception & Performance 22, 6 (1996), 1467–1481.
- Bartram,
L., Ware, C., and Calvert, T. Filtering and integrating visual
information with motion. Information Visualization 1, 1 (2002),
66–79.
- Bartram,
L., Ware, C., and Calvert, T. Moticons: Direction, distraction, and
task. International Journal of Computer-Human Studies 58, 5
(2003), 515–545.
- Bauer, B.,
Jolicoeur, P., and Cowan, W. B. Visual search for colour targets that
are or are not linearly-separable from distractors. Vision Research
36 (1996), 1439–1446.
- Bauer, B.,
Jolicoeur, P., and Cowan, W. B. The linearly separability effect in
color visual search: Ruling out the additive color
hypothesis. Perception & Psychophysics 60, 6 (1998),
1083–1093.
- Beck, J.,
Prazdny, K., and Rosenfeld, A. A theory of textural
segmentation. Human and Machine Vision, J. Beck, K. Prazdny,
and A. Rosenfeld, Eds. Academic Press, New York, New York, 1983,
pp. 1–39.
- Bergman, L. D.,
Rogowitz, B. E., and Treinish, L. A. A rule-based tools for assisting
colormap selection. Proceedings Visualization '95 (Atlanta,
Georgia, 1995), pp. 118–125.
- Birren,
F. Munsell: A grammar of color. Van Nostrand Reinhold Company,
New York, New York, 1969.
- Braddick,
O. J. and Holliday, I. E. Serial search for targets defined by a
divergence or deformation of optical flow. Perception 20
(1987), 345–354.
- Brown,
J. L. Flicker and intermittent stimulation. Vision and Visual
Perception, C. H. Graham, Ed. John Wiley & Sons, New York, New
York, 1965, pp. 251–320.
- Callaghan,
T. C. Dimensional interaction of hue and brightness in preattentive
field segregation. Perception & Psychophysics 36, 1 (1984),
25–34.
- Callaghan,
T. C. Interference and domination in texture segregation: hue,
geometric form, and line orientation. Perception &
Psychophysics 46, 4 (1989), 299–311.
- Callaghan,
T. C. Interference and dominance in texture segregation. Visual
Search, D. Brogan, Ed. Taylor & Francis, New York, New York,
1990, pp. 81–87.
- CIE. CIE
Publication No. 15, Supplement Number 2 (E-1.3.1): Official
Recommendations on Uniform Color Spaces, Color-Difference Equations,
and Metric Color Terms. Commission Internationale de
L'Éclairge, 1976.
- Cutting,
J. E. and Millard, R. T. Three gradients and the perception of flat
and curved surfaces. Journal of Experimental Psychology: General
113, 2 (1984), 198–216.
- Driver, J.,
McLeod, P., and Dienes, Z. Motion coherence and conjunction search:
Implications for guided search theory. Perception &
Psychophysics 51, 1 (1992), 79–85.
- Duncan,
J. Boundary conditions on parallel search in human
vision. Perception 18 (1989), 457–469.
- Duncan,
J. and Humphreys, G. W. Visual search and stimulus
similarity. Psychological Review 96, 3 (1989), 433–458.
- D'Zmura,
M. Color in visual search. Vision Research 31, 6 (1991),
951–966.
- Ebert,
D. S. and Rheingans, P. Volume illustration: Non-photorealistic
rendering of volume models. Proceedings IEEE Visualization 2000
(San Francisco, California, 2000), 195–202.
- Egeth,
H. E. and Yantis, S. Visual attention: Control, representation, and
time course. Annual Review of Psychology 48, (1997),
269–297.
- Enns,
J. T. Seeing textons in context. Perception & Psychophysics
39 (1986), 143–147.
- Enns, J. T. The
promise of finding effective geometric codes. Proceedings
Visualization '90 (San Francisco, California, 1990),
pp. 389–390.
- Enns,
J. T. Three-dimensional features that pop out in visual
search. Visual Search, D. Brogan, Ed. Taylor & Francis, New
York, New York, 1990, pp. 37–45.
- Enns,
J. T. and Rensink, R. A. Sensitivity to three-dimensional orientation
in visual search. Psychological Science 1, 5 (1990),
323–326.
- Enns,
J. T. and Rensink, R. A. Influence of scene-based properties on visual
search. Science 247 (1990), 721–723.
- Gebb, J. W.,
Mowbray, G. H., and Byham, C. L. Difference lumens for photic
intermittence. Quarterly Journal of Experimental Psychology 7
(1955), 49–55.
- Gooch, B. and
Gooch, A. Non-photorealistic rendering. A K Peters, Ltd.,
Natick, Massachusetts, 2001.
- Grinstein, G.,
Pickett, R., and Williams, M. EXVIS: An exploratory data visualization
environment. Proceedings Graphics Interface '89 (London,
Canada, 1989), pp. 254–261.
- Haralick,
R. M., Shanmugam, K., and Dinstein, I. Textural features for image
classification. IEEE Transactions on Systems, Man, and Cybernetics
SMC-3, 6 (1973), 610–621.
- Healey,
C. G. Choosing effective colours for data
visualization. Proceedings Visualization '96 (San Francisco,
California, 1996), pp. 263–270.
- Healey,
C. G. Formalizing artistic techniques and scientific visualization for
painted renditions of complex information spaces. Proceedings
International Joint Conference on Artificial Intelligence (IJCAI
2001) (Seattle, Washington, 2001), 371–376.
- Healey, C. G.,
Booth, K. S., and Enns, J. T. Harnessing preattentive processes for
multivariate data visualization. Proceedings Graphics Interface
'93 (Toronto, Canada, 1993), pp. 107–117.
- Healey,
C. G. and Enns, J. T. Building perceptual textures to visualize
multidimensional datasets. Proceedings Visualization '98
(Research Triangle Park, North Carolina, 1998), pp. 111–118.
- Healey,
C. G. and Enns, J. T. Large datasets at a glance: Combining textures
and colors in scientific visualization. IEEE Transactions on
Visualization and Computer Graphics 5, 2 (1999), 145–167.
- Healey,
C. G. and Enns, J. T. Perception and painting: A search for effective,
engaging visualizations. IEEE Computer Graphics & Applications
22, 2 (2002), 10–15.
- Healey,
C. G., Enns, J. T., Tateosian, L. G., and Remple,
M. Perceptually-based brush strokes for nonphotorealistic
visualization. ACM Transactions on Graphics 23, 1 (2004),
64–96.
- Hohnsbein,
J. and Mateeff, S. The time it takes to detect changes in the speed
and direction of visual motion. Vision Research 38, 17 (1998),
2569–2573.
- Huang,
L. and Pashler, H. A boolean map theory of visual
attention. Psychological Review 114, 3 (2007), 599–631.
- Huang,
L., Triesman, A., and Pashler, H. Characterizing the limits of human
visual awareness. Science 317 (2007), 823–825.
- Huber, D. E.
and Healey, C. G. Visualizing Data With Motion. Proceedings
Visualization 2003 (Minneapolis, Minnesota, 2003),
pp. 527–534.
- Interrante,
V. Harnessing natural textures for multivariate visualization. IEEE
Computer Graphics & Applications 20, 6 (2000), 6–11.
- Interrante,
V. and Kim, S. Investigating the effect of texture orientation on the
perception of 3D shape. Proceedings Human Vision and Electronic
Imaging VI (San Jose, California, 2001), 330–339.
- Interrante,
V., Kim, S., and Hagh-Shenas, H. Conveying 3D shape with texture:
Recent advances and experimental results. Proceedings Human Vision
and Electronic Imaging VII (San Jose, California, 2002),
197–206.
- Julész, B. Foundations of
Cyclopean Perception. University of Chicago Press, Chicago,
Illinois, 1971.
- Julész, B. Experiments in
the visual perception of texture. Scientific American (1975),
34–43.
- Julész, B. Textons, the
elements of texture perception, and their interactions. Nature
290 (1981), 91–97.
- Julész, B. A theory of
preattentive texture discrimination based on first-order statistics of
textons. Biological Cybernetics 41 (1981), 131–138.
- Julész, B. A brief
outline of the texton theory of human vision. Trends in
Neuroscience 7, 2 (1984), 41–45.
- Julész,
B. and Bergen, J. R. Textons, the fundamental elements in preattentive
vision and the perception of textures. Bell System Technical
Journal 62, 6 (1983), 1619–1645.
- Julész, B., Gilbert,
E. N., and Shepp, L. A. Inability of humans to discriminate between
visual textures that agree in their second-order
statistic–Revisited. Perception 2 (1973), 391–405.
- Julész, B., Gilbert,
E. N., and Victor, J. D. Visual discrimination of textures with
identical third-order statistics. Biological Cybernetics 31
(1978), 137–140.
- Kawai, M.,
Uchikawa, K., and Ujike, H. Influence of color category on visual
search. Annual Meeting of the Association for Research in Vision
and Ophthalmology (Fort Lauderdale, Florida, 1995), #2991.
- Kerlick,
G. D. Moving iconic objects in scientific
visualization. Proceedings Visualization '90 (San Francisco,
California, 1990), pp. 124–130.
- Kim, S.,
Hagh-Shenas, H., and Interrante, V. Showing shape with texure: Two
directions seem better than one. Proceedings Human Vision and
Electronic Imaging VIII (Santa Clara, California, 2003),
332–339.
- Kim, S.,
Hagh-Shenas, H., and Interrante, V. Conveying shape with texture: An
experimental investigation of the impact of texture type on shape
categorization judgments. Proceedings InfoVis 2003 Symposium
(Seattle, Washington, 2003), 163–170.
- Kirby, R. M.,
Marmanis, H., and Laidlaw, D. H. Visualizing multivalued data from 2D
incompressible flows using concepts from painting. Proceedings
Visualization '99 (San Francisco, California, 1999),
pp. 333–340.
- Laidlaw,
D. H. Loose, artistic "textures" for visualization. IEEE
Computer Graphics & Applications 21, 2 (2001), 6–9.
- Laidlaw, D. H.,
Ahrens, E. T., Kremers, d., Avalos, M. J., Jacobs, R. E., and
Readhead, C. Visualizing diffuse tensor images of the mouse spinal
cord. Proceedings Visualization '98 (Research Triangle Park,
North Carolina, 1998), pp. 127–134.
- Levin, D. T. and Simons,
D. J. Failure to detect changes to attended objects in motion
pictures. Psychonomic Bulletin and Review 4, 4 (1997),
501–506.
- Liu, G.,
Healey, C. G., and Enns, J. T. Target detection and localization in
visual search: A dual systems perspective. Perception &
Psychophysics 65, 5 (2003), 678–694.
- Lu, A.,
Morris, C. J., Ebert, D. S., Rheingans, P., and Hansen,
C. Non-photorealistic volume rendering using stippling
techniques. Proceedings Visualization 2002 (Boston,
Massachusetts, 2002), pp. 211–218.
- Mack, A. and Rock,
I. Inattentional Blindness. MIT Press, Menlo Park, California,
1998.
- Mateeff, S.,
Dimitrov, G., and Hohnsbein, J. Temperal thresholds and reaction time
to changes in velocity of visual motion. Vision Research 35, 3
(1995), 355–363.
- McCormick,
B. H., DeFanti, T. A, and Brown, M. D. Visualization in scientific
computing. Computer Graphics 21, 6 (1987), 1–14.
- Meier,
B. J. Painterly rendering for animation. SIGGRAPH '96 Conference
Proceedings (New Orleans, Louisiana, 1996), pp. 477–484.
- Mowbray,
G. H. and Gebhard, J. W. Differential sensitivity of the eye to white
light. Science 121 (1955), 137–175.
- Müller, H. J., Humphreys,
G. W., Quinlan, P. T., and Riddoch, M. J. Combined-feature coding in
the form domain. In Visual Search, D. Brogan, Ed. Taylor &
Francis, New York, New York, 1990, pp. 47–55.
- Munsell, A. H. A
color notation. Geo. H. Ellis Co., Boston, Massachusetts, 1905.
- Nakayama,
K. and Silverman, G. H. Serial and parallel processing of visual
feature conjunctions. Nature 320 (1986), 264–265.
- Nagy,
A. L. and Sanchez, R. R. Critical color differences determined with a
visual search task. Journal of the Optical Society of America A
7, 7 (1990), 1209–1217.
- Nagy, A. L.,
Sanchez, R. R., and Hughes, T. C. Visual search for color differences
with foveal and peripheral vision. Journal of the Optical Society
of America A 7, 10 (1990), 1995–2001.
- Pomerantz,
J. and Pristach, E. A. Emergent features, attention, and perceptual
glue in visual form perception. Journal of Experimental Psychology:
Human Perception & Performance 15, 4 (1989), 635–649.
- Quinlan,
P. T. and Humphreys, G. W. Visual search for targets defined by
combinations of color, shape, and size: An examination of task
constraints on feature and conjuction searches. Perception &
Psychophysics 41, 5 (1987), 455–472.
- Rao,
A. R. and Lohse, G. L. Identifying high level features of texture
perception. CVGIP: Graphical Models and Image Processing 55, 3
(1993), 218–233.
- Rao, A. R.and
Lohse, G. L. Towards a texture naming system: Identifying relevant
dimensions of texture. Proceedings Visualization '93 (San Jose,
California, 1993), pp. 220–227.
- Rensink,
R. A. To see or not to see: The need for attention to perceive changes
in scenes. Psychological Science 8, 5 (1997), 368–373.
- Rensink,
R. A. Seeing, sensing, and scrutinizing. Vision Research 40,
10-12 (2000), 1469–1487.
- Rheingans,
P. and Ebert, D. S. Volume illustration: Nonphotorealistic rendering
of volume models. IEEE Transactions on Visualization and Computer
Graphics 7, 3 (2001), 253–264.
- Rheingans,
P. and Tebbs, B. A tool for dynamic explorations of color
mappings. Computer Graphics 24, 2 (1990), 145–146.
- Rogowitz,
B. E. and Treinish, L. A. An architecture for rule-based
visualization. Proceedings Visualization '93 (San Jose,
California, 1993), pp. 236–243.
- Sagi,
D. and Julész, B. Detection versus discrimination of visual
orientation. Perception 14 (1985), 619–628.
- Sagi,
D. and Julész, B. The "Where" and "What" of
vision. Science 228 (1985), 1217–1219.
- Smith,
P. H. and Van Rosendale, J. Data and visualization corridors report on
the 1998 CVD workshop series (sponsored by DOE and
NSF). Tech. Rep. CACR-164, Center for Advanced Computing Research,
California Institute of Technology, 1998.
- Simons,
D. J. In sight, out of mind: When object representations
fail. Psychological Science 7, 5 (1996), 301–305.
- Simons,
D. J. Current approaches to change blindness. Visual Cognition
7, 1/2/3 (2000), 1–15.
- Simons, D. J. and Rensink, R. A. Change
blindness: Past, present, and future. Trends in Cognitive Science
9, 1 (2005), 16–20.
- Snowden,
R. J. Texture segregation and visual search: A comparison off the
effects of random variations along irrelevant dimensions. Journal
of Experimental Psychology: Human Perception & Performance 24,
5 (1998), 1354–1367.
- Strothotte,
T. and Schlechtweg, S. Non-photorealistic computer graphics:
Modeling, rendering, and animation. Morgan Kaufmann Publishers,
Inc., San Francisco, California, 2002.
- Tamura, H.,
Mori, S., and Yamawaki, T. Textural features corresponding to visual
perception. IEEE Transactions on Systems, Man, and Cybernetics
SMC-8, 6 (1978), 460–473.
- Trick,
L. and Pylyshyn, Z. Why are small and large numbers enumerated
differently? A limited capacity preattentive stage in
vision. Psychology Review 101 (1994), 80–102.
- Treisman,
A. Preattentive processing in vision. Computer Vision, Graphics and
Image Processing 31 (1985), 156–177.
- Treisman,
A. Search, similarity, and integration of features between and within
dimensions. Journal of Experimental Psychology: Human Perception
& Performance 17, 3 (1991), 652–676.
- Treisman,
A. and Gelade, G. A feature-integration theory of
attention. Cognitive Psychology 12 (1980), 97–136.
- Treisman, A. and Gormican,
S. Feature analysis in early vision: Evidence from search
asymmetries. Psychological Review 95, 1 (1988), 15–48.
- Treisman,
A. and Souther, J. Illusory words: The roles of attention and top-down
constraints in conjoining letters to form words. Journal of
Experimental Psychology: Human Perception & Performance 12
(1986), 107–141.
- Triesch, J.,
Ballard, D. H., Hayhoe, M. M., and Sullivan, B. T. What you see is
what you need. Journal of Vision 3, 1 (2003), 86–94.
- Tse, P. U, Shienberg, D. L., and
Logothetis, N. K. Attentional enhancement opposite a peripheral flash
revealed using change blindness. Psychological Science 14, 2
(2003), 91–99.
- Tynan, P. D. and
Sekuler, R. Motion processing in peripheral vision: Reaction time and
perceived velocity. Vision Research 22, 1 (1982), 61–68.
- van Doorn,
A. J. and Koenderink, J. J. Temporal properties of the visual
detectability of moving spatial white noise. Experimental Brain
Research 45 (1982), 179–188.
- van Doorn,
A. J. and Koenderink, J. J. Spatial properties of the visual
detectability of moving spatial white noise. Experimental Brain
Research 45 (1982), 189–195.
- Ware, C. Color
sequences for univariate maps: Theory, experiments, and
principles. IEEE Computer Graphics & Applications 8, 5
(1988), 41–49.
- Ware,
C. Information Visualization: Perception for Design. Morgan
Kaufmann Publishers, Inc., San Francisco, California, 2000.
- Ware, C. and
Knight, W. Using visual texture for information display. ACM
Transactions on Graphics 14, 1 (1995), 3–20.
- Weigle, C.,
Emigh, W. G., Liu, G., Taylor, R. M., Enns, J. T., and Healey,
C. G. Oriented texture slivers: A technique for local value estimation
of multiple scalar fields. Proceedings Graphics Interface 2000
(Montréal, Canada, 2000), pp. 163–170.
- Wheeler,
M. E. and Triesman, A. E. Binding in short-term visual
memory. Journal of Experimental Psychology: General 131, 1
(2002), 48–64.
- Wolfe,
J. M. Guided Search 2.0: A revised model of visual
search. Psychonomic Bulletin & Review 1, 2 (1994),
202–238.
- Wolfe,
J. M. and Cave, K. R. Deploying visual attention: The Guided Search
model. In AI and the Eye, T. Troscianko and A. Blake, Eds. John
Wiley & Sons, Inc. Chichester, United Kingdom, 1989,
pp. 79–103.
- Wolfe,
J. M., Cave, K. R., and Franzel, S. L. Guided Search: An alternative
to the feature integration model for visual search. Journal of
Experimental Psychology: Human Perception & Performance 15, 3
(1989), 419–433.
- Wolfe, J. M. and
Franzel, S. L. Binocularity and visual search. Perception &
Psychophysics 44 (1988), 81–93.
- Wolfe,
J. M., Friedman-Hill, S. R., Stewart, M. I., and O'Connell, K. M. The
role of categorization in visual search for orientation. Journal of
Experimental Psychology: Human Perception & Performance 18, 1
(1992), 34–49.
- Wolfe,
J. M., Klempen, N., and Dahlen, K. Postattentive vision. Journal of
Experimental Psychology: Human Perception & Performance 26, 2
(2000), 693–716.
- Wolfe,
J. M., Yu, K. P., Stewart, M. I., Shorter, A. D., Friedman-Hill,
S. R., and Cave, K. R. Limitations on the parallel guidance of visual
search: Color × color and orientation × orientation
conjunctions. Journal of Experimental Psychology: Human Perception
& Performance 16, 4 (1990), 879–892.
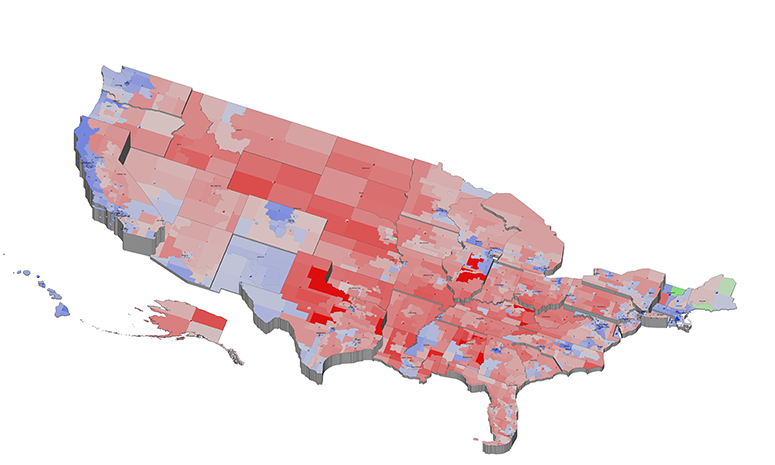


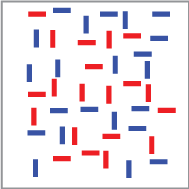
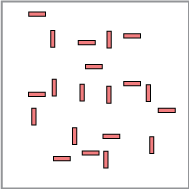


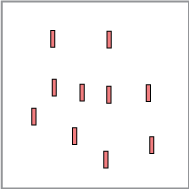
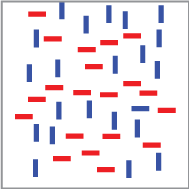
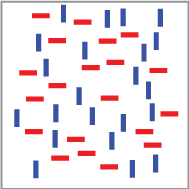
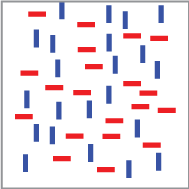
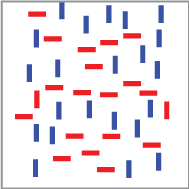
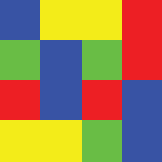
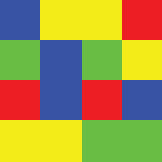
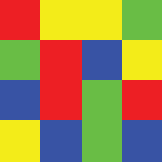
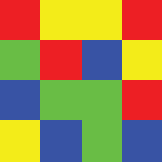

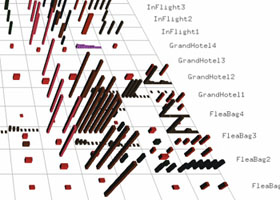
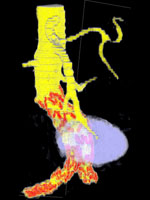
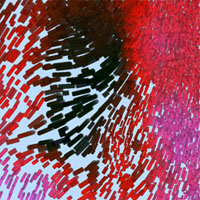
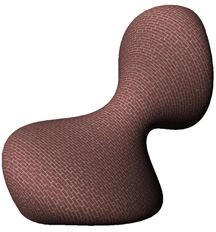
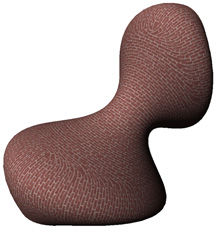
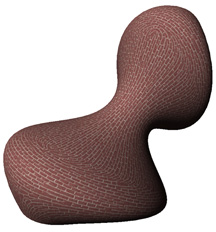
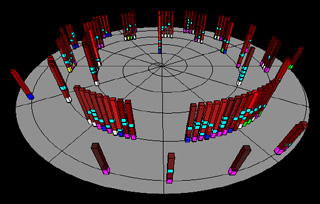
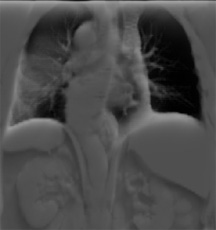
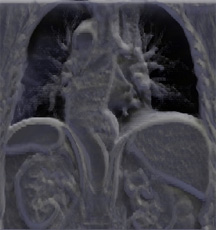
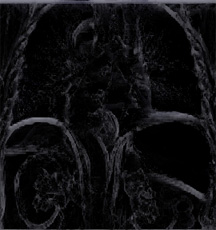
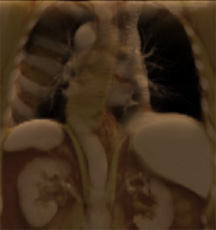

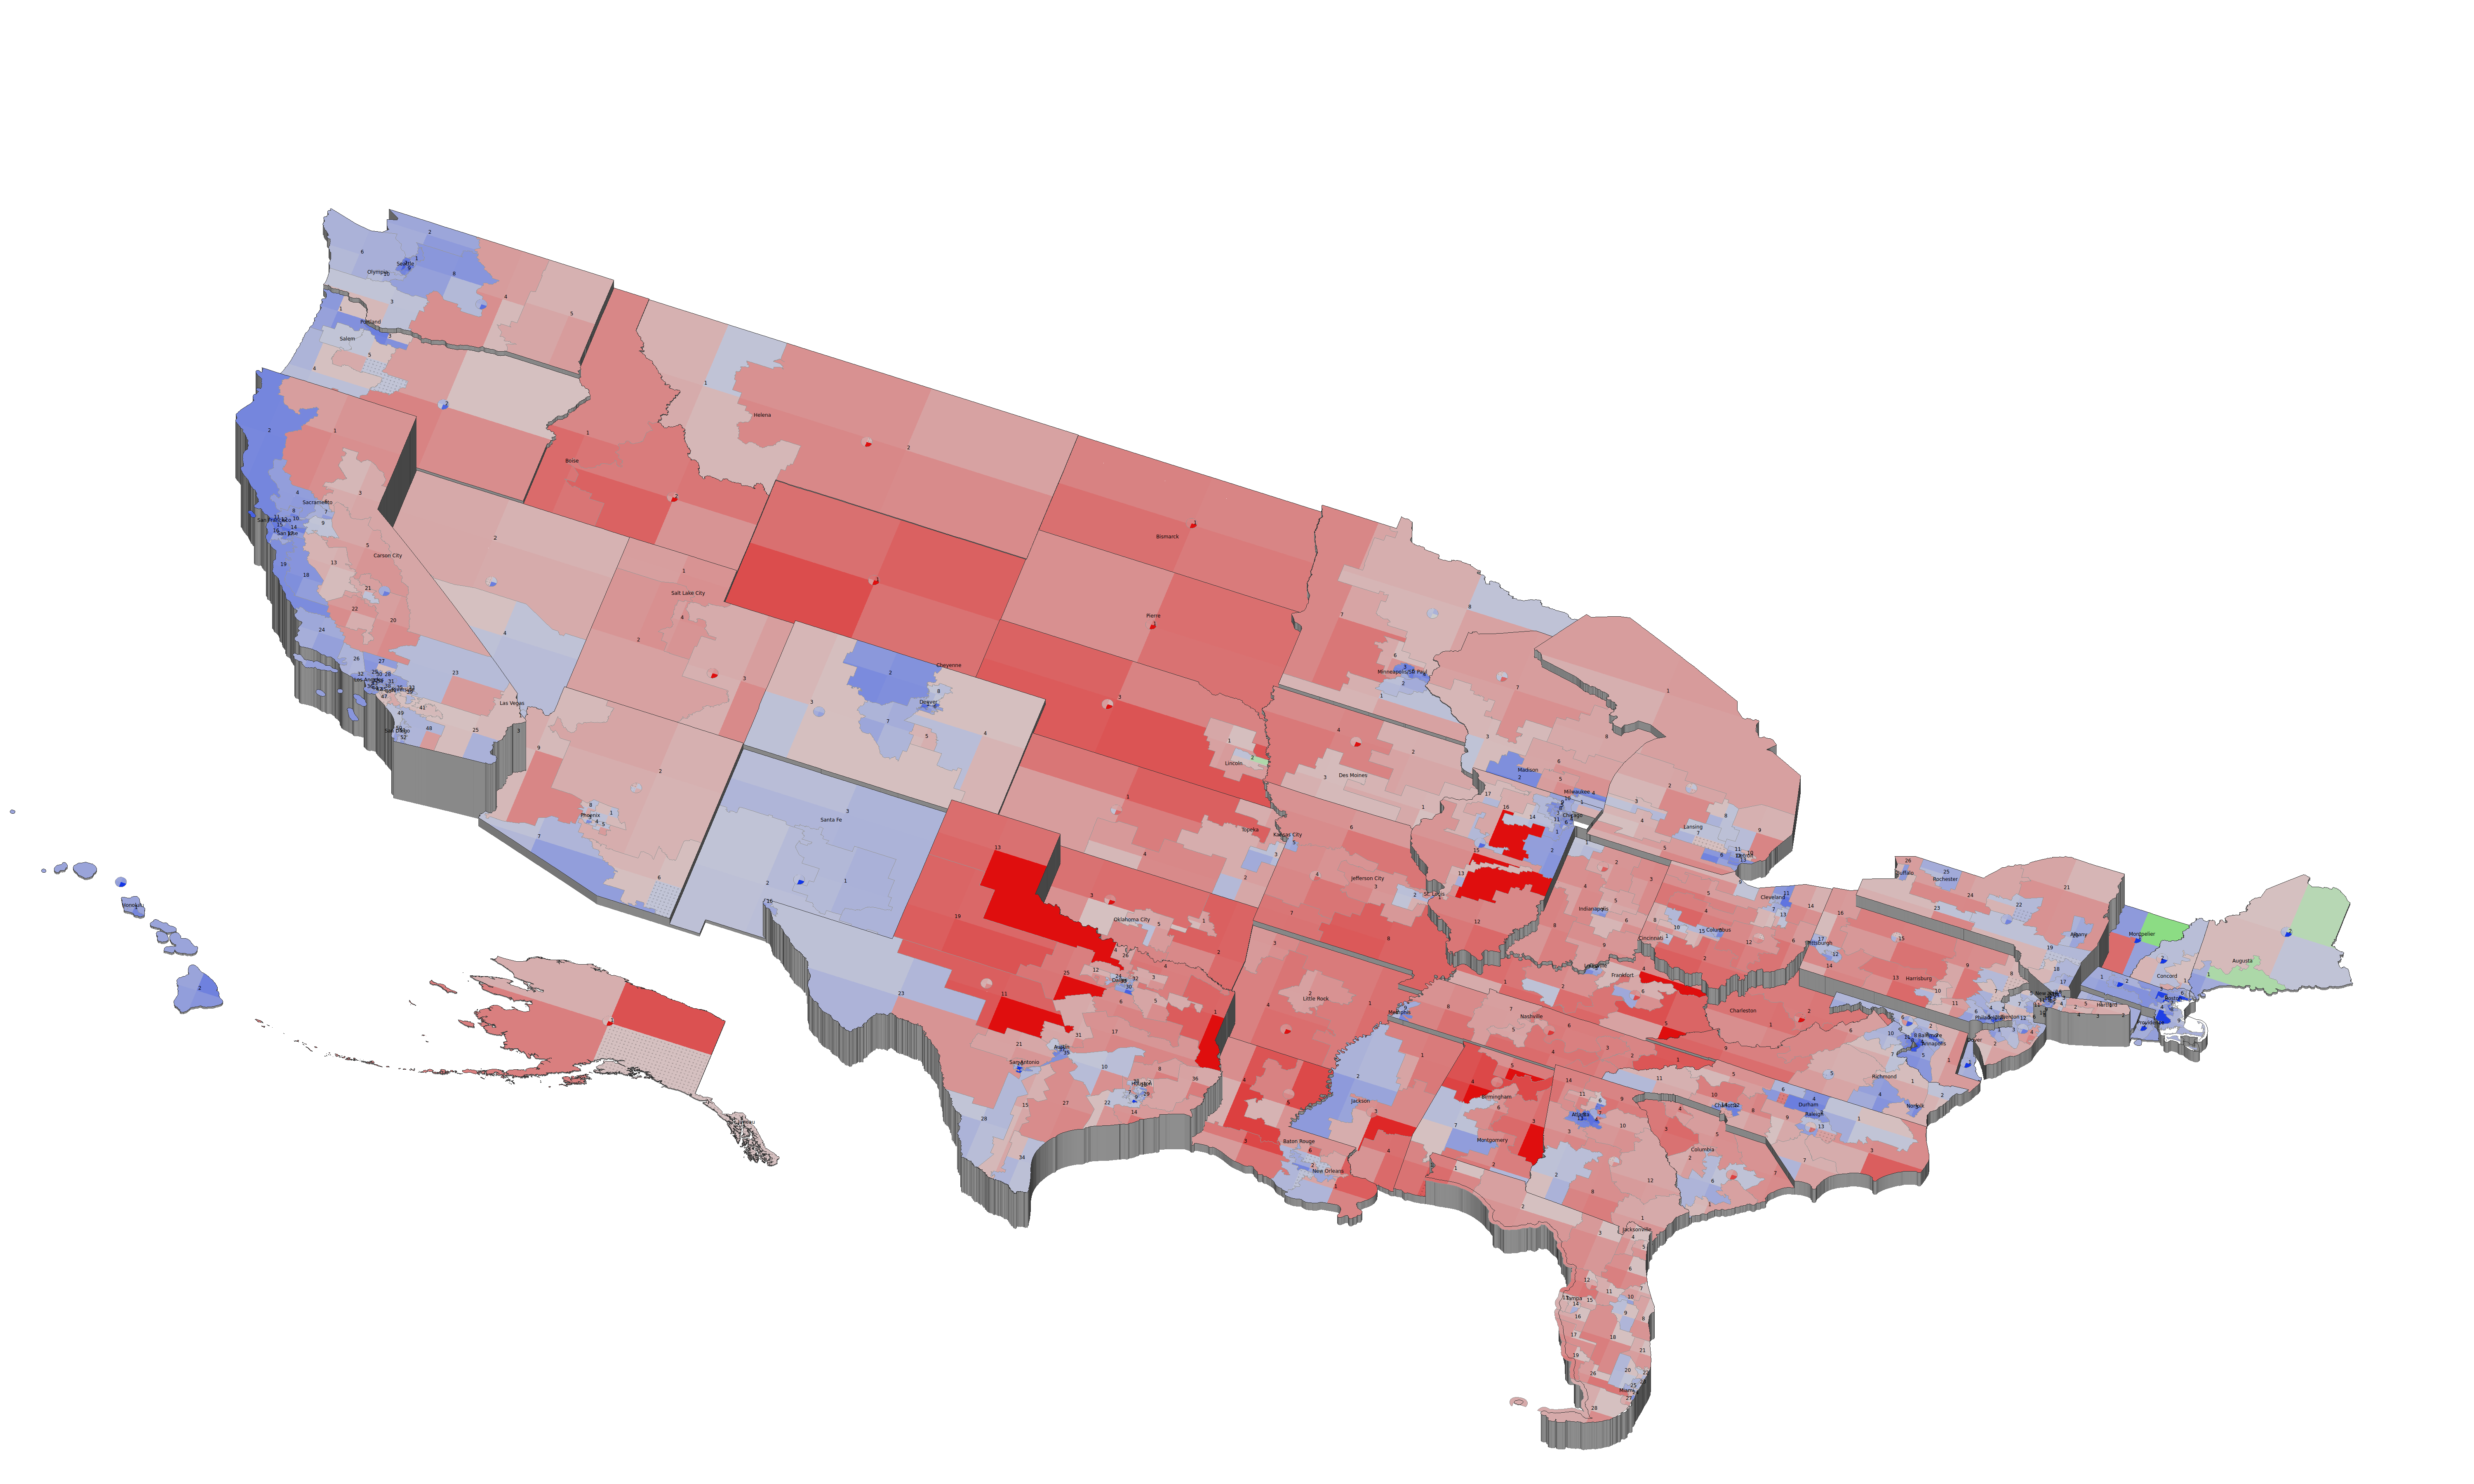