Low |
 Medium |
 Tall |
 Sparse |
 Dense |
 Very Dense |
 Regular |
 Irregular |
 Random |
Pexels: Visualization with Perceptual Textures
Christopher G. Healey
In our visualization environment, each data element is represented by an individual pexel. Attribute values in the data element control the visual appearance of the pexel by modifying its texture dimensions. The result is an array of pexels that form texture patterns. These patterns can be rapidly and accurately analyzed by the low-level human visual system to show structure in the underlying dataset.
Our pexels look like a collection of one or more paper strips. The user maps attributes in the dataset to the density (which controls the number of strips in a pexel), height, regularity, and colour of each pexel. Figure 1a shows an example of height, density, and regularity varying over three discrete values.
Figure 1: Groups of paper strips are used to form a pexel that supports variation of the three perceptual texture dimensions height, density and regularity: (a) each pexel has one of its dimensions varied across three discrete values; (b) a map of North America, pexels represent areas of high cultivation, height mapped to level of cultivation, density mapped to ground type, colour mapped to vegetation type; (c) typhoon Winnie strikes Okinawa and Taiwan, August 16, 1997, height mapped to windspeed (taller for stronger), density mapped to sea-level pressure (denser for lower), and regularity mapped to precipitation (irregular for more rain); (d) a movie of tropical storm Victor, typhoon Winnie, and typhoon Amber moving through the east Asia region
Figure 1b shows an environmental dataset being visualized with pexels. Locations on the map that contain pexels represent areas in North and Central America with high levels of cultivation. Three discrete heights show the level of cultivation (short for 50-74% cultivated, medium for 75-99%, and tall for 100%), density shows the ground type (sparse for alluvial, dense for wetlands), and colour shows the vegetation type (yellow for plains, green for forest, cyan for woods, and purple for shrubland). We used a perceptual colour selection technique [Healey 96] to ensure that all the colours are equally distinguishable from one another. Users can easily identify medium height pexels that correspond to lower levels of cultivation in the central and eastern plains; short pexels can be seen along the spine of Central America. Areas containing wetlands can be seen as dense pexels in Florida, along the eastern coast, and in the southern parts of the Canadian prairies.
Finally, Figure 1c shows typhoon Winnie passing over the islands of Okinawa and Taiwan during August 16, 97. In this image, height is mapped to windspeed (stronger wind produces taller pexels), sea-level pressure is mapped to density (lower pressure produces denser pexels), and precipitation is mapped to regularity (higher precipitation produces more irregular pexels). These three environmental conditions are used to represent typhoon activity in the northwest Pacific Ocean. Users can easily identify the collection of tall, dense pexels over Okinawa and Taiwan that define the typhoon's area of influence.
The perceptual texture dimensions we use were not chosen in an ad-hoc fashion; psychophysical experiments were run to test the perceptual salience of each dimension, and to see how the dimensions interact with one another. A complete discussion of these results can be found in [Healey 96, Healey 98, Healey and Enns 98]. In summary, our results showed that a user's low-level visual system can very rapidly and accurately detect differences in height, density, colour, and to a lesser extent, regularity. Identification can usually be performed in 250 milliseconds or less, and is independent of the number of elements being displayed. Pexels allow users to search for data elements with a unique visual feature, identify boundaries, track regions as they move in time and space, and estimate the percentage of elements with a specific visual feature. Visualization with perceptual textures allow viewers to perform rapid and accurate exploratory visual analysis on large, multidimensional datasets.
We will use our typhoon dataset give an example of how attribute values are mapped to perceptual texture dimensions. The names "typhoon" and "hurricane" are region-specific, and refer to the same type of weather phenomena: an atmospheric disturbance generally characterized by low pressure, thunderstorm activity, and a cyclic wind pattern. Storms of this type with windspeeds below 17m/s (about 38mph) are called "tropical depressions" When windspeeds exceed 17m/s, they become "tropical storms". This is also when storms are assigned a specific name. When windspeeds reach 33m/s (about 74mph), a storm becomes a typhoon (in the Northwest Pacific) or a hurricane (in the Northeast Pacific and North Atlantic).
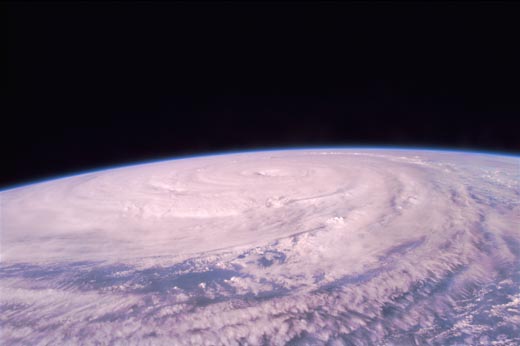
Figure 2: An image of typhoon Winnie, taken by the STS-85 crew of the Space Shuttle Discovery on August 13, 1997; swirling in the Pacific Ocean with winds in excess of 160 miler per hour, Winnie became one of the stronger storm systems in modern times: a Category 5 Hurricane
We combined information from a number of different sources to collect the data we needed. A U.S. Navy elevation dataset was used to obtain land elevations at ten minute latitude and longitude intervals. Land-based weather station readings collected from around the world and archived by the National Climatic Data Center provided daily measurements for eighteen separate environmental conditions. Finally, satellite archives made available by the Global Hydrology and Climate Center contained daily open-ocean windspeed measurements at thirty minute latitude and longitude intervals. The National Climatic Data Center defined the 1997 typhoon season to run from August 1 to October 31; each of our datasets contained measurements for this time period.
We chose to visualize three environmental conditions related to typhoons: windspeed, pressure, and precipitation. All three values were measured on a daily basis at each land-based weather station, but only daily windspeeds were available for open-ocean positions. In spite of the missing open-ocean pressure and precipitation, we were able to track storms as they moved across the Northwest Pacific Ocean. When the storms made landfall the associated windspeed, sea-level pressure, and precipitation were provided by weather stations along their path.
Increasing windspeed is mapped to an increasing pexel height. Windspeed has two important boundaries: 17m/s (where tropical depressions become tropical storms) and 33m/s (where storms become typhoons). We mirror these boundaries with height discontinuities. Pexel height increases linearly from 0-17m/s. At 17m/s, height approximately doubles, then continues linearly from 17-33m/s. At 33m/s another height discontinuity is introduced, followed by a linear increase for any windspeeds over 33m/s.
| Depression | Storm | Typhoon | ||||||
 |
 |
 |
 |
 |
 |
|||
| 0m/s | ··· | 17m/s | ··· | 33m/s | ··· | 52m/s | ||
Figure 3: Examples of the pexel heights used to denote windspeed, starting with a height of 0 for windspeed 0m/s, height increases linearly to 17m/s, a height discontinuity at 17m/s denotes the boundary between tropical depressions and tropical storms, another height discontinuity at 33m/s to denote the boundary between tropical storms and typhoons
Pressure is represented with pexel density. An increase in pressure is mapped to a decrease in pexel density (i.e., very dense pexels represent areas of very low pressure). Pressure below 996 millibars produces very dense pexels. Pressure between 996 and 1014 millibars is represented by dense pexels. Pressure over 1014 millibars results in sparse pexels.
 |
|
 |
|
 |
|
|||
| < 996mb | ··· | 996mb | ··· | 1014mb | ··· | > 1014mb | ||
Figure 4: Examples of the pexel densities used to denote pressure, starting with a density of 2x2 for pressure below 996 millibars, moving to a density of 2x1 for pressure between 996 and 1014 millibars, finally a density of 1x1 for pressure over 1014 millibars
Precipitation is represented with pexel regularity. High levels of precipitation result in an irregular pexel pattern. Pexel positions are held regular for a daily rainfall of 0.13 inches or less (the median value for the time period we visualized). Daily rainfall over 0.13 inches produces an increased pexel irregularity.
 |
|
|
 |
||
| 0.0" | ··· | 0.13" | ··· | 0.42" | |
Figure 5: Examples of the pexel regularity used to denote precipitation, regular placement is used for daily rainfall up to 0.13 inches, daily rainfall over 0.13 inches results in increasing randomness
These mappings combine to produce a visualization system that allows users to track typhoons as regions of tall, dense pexels. One interesting result was immediately evident when we began our analysis: typhoon activity was not represented by high windspeed values in our open-ocean dataset. Typhoons normally contain severe rain and thunderstorms. The high levels of cloud-based water vapor produced by these storms block the satellites that are used to measure open-ocean windspeeds. The result is an absence of any windspeed values within a typhoon's spatial extent. Rather than appearing as a local region of high windspeeds, typhoons on the open-ocean are displayed as a "hole", an ocean region without any windspeed readings (see Figures 6b and 6c). This absence of a visual feature (i.e., a hole in the texture field) is large enough to be salient in our displays, and can be preattentively identified and tracked over time. Therefore, users have little difficulty finding storms and watching them as they move across the open ocean. When a storm makes landfall, the weather stations along the storm's path provide the proper windspeed, as well as pressure and precipitation. Weather stations measure windspeed directly, rather than using satellite images, so high levels of cloud-based water vapor cause no loss of information.
Figure 6 shows windspeed, pressure, and precipitation around Japan, Korea, and Taiwan during August, 1997. Figure 6a looks north, and displays normal summer conditions across Japan on August 1, 1997. Figure 6b, looking south, tracks typhoon Winnie (one of the region's major typhoons) approaching along an east to west path across the Northwest Pacific Ocean on August 13, 1997. Figure 6c shows typhoon Winnie three days later as it moves through Taiwan. Weather stations within the typhoon show the expected strong winds, low pressure, and high levels of rainfall. These results are easily identified as tall, dense, irregular pexels.


Click on any image to view the corresponding movie
(d)
Figure 6: (a) Weather conditions for Japan and Korea, and windspeeds for the surrounding open ocean, August 1, 1997; (b) looking south, typhoon Winnie moves east to west across the Northwest Pacific, August 13, 1997; (c) typhoon Winnie strikes Okinawa and Taiwan, August 16, 1997; (d) a movie of tropical storm Victor, typhoon Winnie, and typhoon Amber moving through the east Asia region
Our visualization techniques are designed to allow rapid, accurate, and relatively effortless visual analysis on the resulting images. This is accomplished by exploiting the human visual system. The low-level visual system can perform certain exploratory analysis tasks (i.e., target identification, boundary detection, region tracking, and estimation) very rapidly and accurately, without the need for focused attention [Healey 96, Healey et al. 96]. These tasks are often called "preattentive", because their completion precedes attention in the visual system [Triesman 85, Wolfe 94] (see also our online description of preattentive processing). More importantly, preattentive tasks are independent of display size; an increase in the number of elements in the display causes little or no increase in the amount of time required to complete the analysis task. Unfortunately, preattentive visualization tools cannot be built by mapping data attributes to visual features in an ad-hoc fashion. Certain combinations of visual features will actively interfere with the low-level visual system, making it much more difficult to complete the corresponding visualization task. Any technique that depends on the low-level visual system must be designed to avoid this kind of interference.
Our experiments were designed to investigate a user's ability to rapidly and accurately identify target pexels defined by a particular height, density, or regularity. Users were asked to determine whether a small group of pexels with a particular type of texture (e.g., a group of taller pexels or a group of denser pexels) was present or absent in a 20x15 array. Conditions like target pexel type, exposure duration, target group size, and background texture dimensions differed for each display. This allowed us to test for preattentive task performance, visual interference, and a user preference for a particular target type. In all cases, user accuracy was used to measure performance.
A complete description of our experiments and results can be found in our paper on perceptual textures. In summary, statistical analysis of user performance showed:
| [Healey et al. 96] | Healey, C. G., Booth, K. S., and Enns, J. T. (1996). High-Speed Visual Estimation Using Preattentive Processing. In ACM Transactions on Computer-Human Interaction 3, 2, 107-135. |
| [Healey 96] | Healey, C. G. (1996). Choosing Effective Colours for Data Visualization. In Proceedings IEEE Visualization '96 (San Francisco, California), pp. 263-270. |
| [Healey 98] | Healey, C. G. (1998). On The Use of Perceptual Cues and Data Mining for Effective Visualization of Scientific Datasets. In Proceedings Graphics Interface '98, (Vancouver, Canada), pp. 177-184. |
| [Healey and Enns 98] | Healey, C. G. and Enns, J. T. (1998). Building Perceptual Textures to Visualize Multidimensional Datasets. In Proceedings IEEE Visualization '98, (Research Triangle Park, North Carolina), pp. 111-118. |
| [Interrante 97] | Interrante, V. (1997). Illustrating Surface Shape in Volume Data via Principle Direction-Driven 3D Line Integral Convolution. In SIGGRAPH 97 Conference Proceedings (Los Angeles, California), T. Whitted, Ed., pp. 109-116. |
| [Rao and Lohse 93a] | Rao, A. R., and Lohse, G. L. (1993). Identifying High Level Features of Texture Perception CVGIP: Graphics Models and Image Processing 55, 3, 218-233. |
| [Rao and Lohse 93b] | Rao, A. R., and Lohse, G. L. (1993). Towards a Texture Naming System: Identifying Relevant Dimensions of Texture. In Proceedings IEEE Visualization '93 (San Jose, California), pp. 220-227. |
| [Triesman 85] | Triesman, A. (1985). Preattentive Processing in Vision. Computer Vision, Graphics, and Image Processing 31, 156-177. |
| [Wolfe 94] | Wolfe, J. M. (1994). Guided Search 2.0: A Revised Model of Visual Search. Psychonomic Bulletin & Review 1, 2, 202-238. |