[ Home Page ] [ NCSU CS Home Page ] [ NCSU Home Page ]
Note: Work described within is a summary of a paper that was published in Proceedings Graphics Interface 2001; a PDF version of the paper is available for downloading.
Keywords: agents, artificial intelligence, colour, e-commerce, perception, scientific visualization, texture
Scientific visualization is the conversion of collections of strings and numbers (or datasets, as they are often called) into images that allow viewers to perform visual exploration and analysis. Normally, a dataset D = { e_1, ..., e_n } contains n samples points or data elements e_i. A multidimensional dataset represents two or more data attributes A = { A_1, ..., A_m }, m > 1; data elements encode values for each attribute, that is, e_i = { a_i,1, ..., a_i,m }, a_i,j in A_j. Visualization begins with the construction of a data-feature mapping M( V, phi ) that converts the raw data into images that are presented to the viewer. V = { V_1, ... V_m } identifies a visual feature V_j to use to display data attribute A_j. phi_j : A_j &rarr V_j maps the domain of A_j to the range of displayable values in V_j. Based on these definitions, visualization is the selection of M and a viewer's interpretation of the images produced by M. An effective visualization chooses M to support the exploration and analysis tasks the viewer wants to perform.
Increasing the information content during visualization is an important area of research; it was explicitly cited by the DOE/NSF during their recent panel on open problems in visualization [Smi98]. Multidimensional techniques must address both the size n and the dimensionality m of a dataset. Datasets with many millions of elements are not uncommon. Moreover, these datasets can often store information about tens or hundreds of individual attributes. The challenge is to design methods to represent even some of this information simultaneously in a single display, without overwhelming a viewer's ability to make sense of the resulting images.
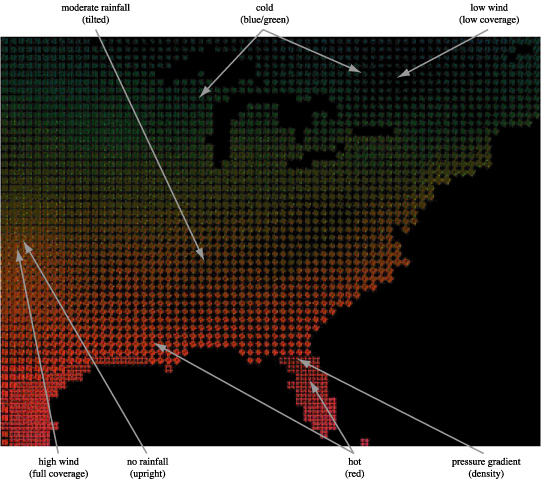
Consider an example weather dataset of monthly averages for m=4 attributes A = { temperature, windspeed, precipitation, pressure }. Rectangular strokes that vary in colour (or luminance for the printed image), size, density, and orientation are used to represent each e_i (Figure 1). V_1 = luminance, phi_1 : dark → light maps temperature from dark (cold) to light (hot). V_2 = coverage, phi_2 : low → high maps windspeed from low coverage (a small percentage of the spatial area represented by e_i is covered by its stroke for low windspeeds) to high coverage (strong windspeeds). V_3 = orientation, phi_3 : 0° → 90° maps precipitation from upright or 0° rotation (no rainfall) to flat or 90° rotation (high rainfall). Finally, V_4 = density, phi_4 : sparse → dense maps pressure from low density (i.e., a single stroke for low pressure) to high density (i.e., a 2 x 2 or 3 x 3 array of strokes for high pressure). Our choice of visual features was guided by results from cognitive vision that describe how the low-level human visual system "sees" information in an image. The result is a visualization that effectively represents four separate attributes together in a single display.
A weather dataset with n=72,384 elements representing monthly average conditions across the continental United States for m=4 attributes A = { temperature, windspeed, precipitation, pressure } visualized using V = { luminance, coverage, orientation, density }; attribute values are mapped to individual feature values using phi_1 = light → dark, phi_2 = low coverage → high coverage, phi_3 = 0° (upright) → 90° (flat), and phi_4 = sparse → dense
New techniques like perceptual and painterly visualization [Hea93, Hea99, Lai98] (Figure 1), line integral convolution [Cab93], and spot noise [van91] represent significant advances in the area of multidimensional display. Unfortunately, these techniques are not always simple to understand or apply. Practitioners are now faced with visualization tools that offer an extensive set of options to present information, but no assistance on how to harness or control the use of these options to produce an effective result.
Some previous work has studied ways to automate the selection of M in certain cases. Rule-based systems [Berg95] suggest a single M based on properties of a dataset. Although promising, this technique suffers from a number of limitations: (1) only one M is recommended for each type of dataset, (2) the parameters used to categorize a dataset are relatively coarse, so many different D will map to the same M, and (3) there is no simple way to automatically modify M to support context or user preferences. Design galleries [Mar97] are used to convert input parameters to images via a mapping function; a set of images maximally dispersed from one another can be automatically identified, arranged, and displayed to provide an overview of how different inputs affect the resulting image. Although expressive, this technique does not help a user pick the "best" M for their data. Perceptual knowledge and visualization expertise are still needed to select an M that is appropriate to a user's visualization and exploration needs.
This paper describes a visualization assistant, a combination of perceptual guidelines and an intelligent search engine designed to identify the data-feature mappings M that are most appropriate for a particular dataset and associated analysis tasks. Our visualization assistant, called ViA, was specifically engineered to satisfy a number of important goals:
The result is a semi-automated system that can identify perceptually salient visualizations for a broad collection of application environments. Viewers can describe their requirements, ask ViA to locate candidate mappings, and refine those mappings as needed to produce a small collection of M that are best suited to a given dataset and analysis task.
One area that has demonstrated significant promise is the use of properties of low-level human vision to guide the display of complex datasets. The DOE/NSF joint panel on visualization emphasized the need to harness perception to increase our ability to represent information [Smi98]. Researchers in cognitive vision have identified a collection of visual features that are detected "preattentively" by the low-level visual system (although we now know that these visual features are influenced by the goals and expectations of the observer, the term preattentive is still useful because it conveys the relative ease with which these processes are completed.) They include many of the visual cues we apply during visualization (e.g., hue, luminance, size, contrast, orientation, and direction of motion). When combined properly, these features can be used to support high-level exploration and analysis. Examples include searching for elements with a specific visual feature, identifying spatial boundaries between groups of elements with common features, tracking elements as they move in time and space, and estimating the number of elements with a particular target feature. Preattentive features and tasks offer three important advantages:
Guidelines from preattentive vision allow us to build M that harness the strengths and avoid the limitations of the low-level visual system.
Recent work in the literature discussed the use of perceptual colour and texture properties to represent multidimensional data [Hea99, Wei00] Experiments were conducted to study the combined use of luminance, hue, size, density, regularity, and orientation during visualization. Results from these experiments can be roughly divided into the following categories:
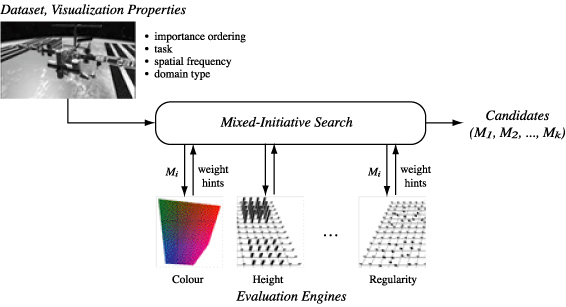
Figure 2: The ViA architecture, showing: a dataset from an external source, along with its viewer-defined properties (importance ordering, task, spatial frequency, domain type); the mixed-initiative search engine, used to construct, evaluate, and improve candidate M; the evaluation engines, used to weight and offer hints on how to improve M; the top k candidates returned to the viewer
Taken together, these results form a foundation to support the construction of perceptually salient visualizations. Unfortunately, balancing the various constraints can be difficult and time consuming. Special care is needed to manage the interdependent nature of the different guidelines. A viewer must repeat this process whenever the dataset properties or analysis tasks are changed. A system that automated even some of this work would free viewers to concentrate on their original goal: to gain new insights into their data through visual exploration and analysis. Semi-automated construction of M would allow viewers to consider multiple scenarios for a particular dataset, to visualize it in numerous ways, and to investigate different groups of analyses, without having to worry about the effort needed to construct each new M.
ViA was designed to perform exactly this type of assisted visualization. Perceptual guidelines are encapsulated into a set of evaluation engines that: (1) rank a particular M based on a dataset's properties and a viewer's analysis needs, and (2) offer suggestions (or hints) on how M might be improved. These engines are combined with an AI-based search algorithm designed to identify and evaluate small collections of M with the highest potential to produce effective visualizations.
ViA's goal is to build a one-to-one mapping of m data attributes to m visual features. This may require choosing from q > m available features. One solution to this problem is to perform an exhaustive search across all possible M, visiting them in lexicographical order and selecting the top k. This simple approach has two problems. First, an exhaustive search, even for small m and q, quickly grows intractable. Second, and more significantly, the search process itself is inflexible. For example, if the viewer finds flaws in all of the top k mappings, the system has little recourse but to return to the next k, even though these are ranked lower in its evaluation.
To avoid these problems, the algorithms within ViA are based on recent advances in interactive and mixed-initiative search [Bur96]. Some forms of planning [Wel94] bear a strong resemblance to the construction of good visualizations, in that both processes rely on the concepts of "flaws" in a partially complete structure or process, total and partial ordering of elements, and incremental construction and evaluation. Mixed-initiative algorithms were modified and extended to support external advice during search. This allows the evaluation engines to guide the search towards perceptually optimal data-feature mappings. It also allows viewers to direct the selection of M to respect context in a dataset, or to include features that they deem important.
The evaluation engines analyze each M based on the dataset's properties and a viewer's analysis needs. ViA begins by asking viewers a set of domain-independent questions about the dataset. The particular properties we identified come from previous work on automated visualization (i.e., in [Berg95,Gal94]), and from the psychophysical experiments used to study the perceptual properties of colour and texture. Specifically, the viewer must define:
Although ViA will try to infer some of the dataset's properties (i.e., spatial frequency and domain type), viewers can override any of these decisions.
ViA's architecture combines a multidimensional dataset, domain-independent information about its properties and the viewer's analysis tasks, a mixed-initiative search algorithm, and the evaluation engines to rank candidate visualizations for the dataset (Figure 2). An initial M is selected by the search algorithm to begin the evaluation. The use of mixed-initiative techniques allow ViA to move intelligently through the space of all possible M. The evaluation engines weight individual M, and offer advice on how M might be improved. If any of the guidelines in an evaluation engine are violated, the engine tries to provide "hints" to fix the problem. For example, suppose A_j → colour. The colour evaluation engine would check to see if A_k → luminance in M. If so, and if A_j > A_k in terms of attribute importance, there may exist a luminance interference effect (i.e., background luminance patterns used to display A_k may mask colour patterns attached to the more important attribute A_j.) The engine would also check to see if A_j had a high spatial frequency, since colour (particularly isoluminant colour) is not well-suited for representing fine spatial detail. Either case would cause the colour evaluation engine to return a low weight for A_j → colour. In both cases it would also "hint" to use luminance rather than colour to represent A_j. The search algorithm collects all m evaluation weights and corresponding hints, then uses the hints to direct its search to a new set of mappings. If the hints are valid, these new mappings should produce better evaluation weights. In this way, we can restrict search to small groups of M with a strong potential for improvement.
Although a completely automated assistant might seem to be an appropriate goal, we do not believe this is feasible. The evaluation engines cannot be perfect, and specific datasets may have unique properties that cannot be addressed in a general way by ViA. The strength of ViA is its ability to produce a collection of mappings that satisfy the rules of human perception. Any one of these mappings can then be extended to include context or to highlight dataset-specific properties. For example, a viewer can require that attribute A_j be displayed using a specific visual feature V_j. ViA will ensure that its candidate mappings include this request. ViA will also report any penalty this choice incurs by telling the viewer: "The best mapping with your constraints is M_j, which evaluates to w_j; the best mapping with no constraints is M_k, which evaluates to a higher value w_k." This allows viewers to balance the importance of constraints against any reduction in the quality of the M they produce. Similarly, viewers could modify a candidate mapping M_j to generate M_j*, then ask ViA to evaluate M_j*. The effect of their changes on the perceptual salience of M_j is shown by comparing weights w_j and w_j*
The mixed-initiative nature of the search allows ViA to query viewers about choices that they are best equipped to answer. For example, discretizing a continuous attribute A_j can allow for improved M (this is particularly true in situations where viewers want to search for or estimate the relative number of a specific value of A_j). If ViA identifies this opportunity, it may ask the viewer: "Will you allow me to discretize attribute A_j into x equal-width ranges?" Other situations can cause ViA to ask to rearranging the relative importance of closely ordered attributes, or to ignore certain analysis tasks for low-importance attributes. This is not only a chance for ViA to generate better candidate mappings; it also allows viewers to refocus their priorities based on results-to-date, and to examine in more detail specific aspects of the application environment. Indeed, certain initial choices for the dataset properties and analysis tasks may receive little consideration until ViA asks for particular changes or modifications. Since a viewer's time and attention are scare resources, ViA restricts its queries to only those situations where obvious improvements may result. ViA caches viewer responses, to ensure that the same (or similar) questions are not asked again.
The current implementation of ViA includes five evaluation engines: luminance and hue (which can be combined into a single "colour" feature), size, density, and regularity. ViA's design makes it easy to add new visual features as their perceptual properties are identified. For example, an orientation engine (based on results in [Wei00]) is now being tested. Future experiments on motion perception will allow us to evaluate the use of flicker, direction of motion, and velocity during visualization.
Two different mixed-initiative search strategies are also being compared: a simple priority queue that orders hints based on the estimated evaluation improvement they will provide, and a modified real-time A* (RTA*) algorithm. Both techniques have successfully identified effective visualizations for a number of practical applications testbeds. The main difference between the two algorithms lies in their flexibility. The priority queue applies hints one after another based on estimated weight improvements, without considering other criteria that may be important to the viewer. The RTA* algorithm models search using a tree structure; both the nodes (which correspond to a particular M) and the edges (which correspond to the modification of a parent node M_j to produce a child M_j*) can carry weights. Node weights represent the result of evaluating the node's M. Edge weights allow us to associate costs with the modifications (i.e., the application of hints) needed to produce M. For example, a viewer might specify an initial mapping M_1, then ask for a collection of perceptually salient M that are similar to M_1. The edges between the root node's M_1 and a candidate child M_j can be used to encode the number and type of hints used to derive M_j. Low-cost paths represent mappings similar to M_1, while high-cost paths denote a mapping with significant modifications.
The Trading Agent Competition (TAC) is a simulated e-commerce auction environment run on the Michigan Internet AuctionBot platform. The AuctionBot is a TCP-based auction server that implements numerous types of auction rules. This allows the simulation of a wide variety of market games. Intelligent auction agents are designed and tested within these markets to study different buying and selling strategies.
During the TAC, each agent acts as a "travel advisor" whose goal is to assemble a travel package for eight fictitious customers. A travel package consists of:
Each customer specifies preferences for the different aspects of his or her trip. For example, customers will tell the agent which days they want to be in Boston, the type of hotel they prefer (economy or luxury), and the entertainment events they want to attend. There are obvious dependencies that must be met, for example, customers need hotel rooms for the duration of their trip, and can only attend entertainment events during that interval. The goal of the agent is to maximize the total satisfaction of its customers (i.e., the sum of their utility functions).
All three products (flights, hotels, and entertainment) are traded in separate markets with different auction rules. For example, the auction for airline tickets runs as follows:
Other auctions run with slightly different rules. For example, two hotels are available during the TAC: an economy hotel (Le FleaBag Inn) and a luxury hotel (Boston Grand Hotel). Both hotels offer sixteen rooms for each evening, with every hotel-evening pair run as a separate auction. The sixteen highest bids for an auction determine who receives rooms. An agent bids for one or more rooms at a chosen price (obviously, this price must exceed a minimum bid price, which is the sixteenth highest bid seen to date). Bids cannot be withdrawn, and only the hotel can offer to sell rooms. An auction ends when: (1) the simulation ends, or (2) a randomly chosen period of inactivity with no new bids passes (this was intended to penalize agents that try to wait until the end of the simulation, check the minimum bid price, then bid slightly above that price to secure the rooms they want). All the rooms are sold at the price of the sixteenth bid (i.e., agents with the highest bids will often pay less than they offered for their rooms).
Finally, every agent receives an initial allotment of tickets for each entertainment event. They can then buy and sell these tickets with other agents. As with hotels, a separate auction is held for each evening-event combination. The auctions run in a manner similar to the stock market: buy or sell requests that match an existing bid are executed immediately; otherwise they are held within the auction until an appropriate bid is received, or until the auction ends.
Although certain aspects of the TAC are simplified, it still provides an excellent simulation of a real-world e-commerce auction environment. Products are bought and sold in real-time, both by external suppliers and by the agents themselves. Careful planning is needed to manage the cost of certain items versus their potential unavailability (i.e., hotel rooms). Different auctions are run using different rules, requiring an agent to implement a variety of tactics to guarantee overall success.
The TAC has been used to study different auction strategies through head-to-head competitions. For example, teams of students in our undergraduate e-commerce course design and implement TAC agents, then compete against one another at the end of the term. In July 2000, twelve teams participated in a TAC run at the Fourth International Conference on Multiagent Systems (ICMAS-00). The agents at ICMAS were selected from an initial group of twenty teams from six countries that competed in a set of qualifying rounds conducted prior to the conference.
As plans were being finalized for the ICMAS competition, it was suggested that a method of visualizing the simulations might be useful. This would allow both participants and observers to follow the progress of each agent as the simulation unfolded. It was also hoped that the strategies of the different agents would be visible within the displays. We decided to ask ViA to try to identify an effective real-time visualization for the TAC. Datasets from a TAC run in our undergraduate e-commerce course were used to select the candidate M.
Five separate attributes were selected for visualization: the time, auction ID, agent ID, price, and quantity for every bid made during the simulation. Although the TAC is relatively simple in its number of attributes, it provides a demonstration of ViA's abilities that is both insightful and manageable. time and auction ID were used to define a bid's x and y-position on a two-dimensional grid. Perceptual texture elements (pexels) that can vary in their hue, luminance, height, density, and regularity of placement were used to represent the remaining attributes: agent ID, price, and quantity. The dataset properties and tasks defined by the TAC designers are summarized in Table 1.
| Attribute | Domain | Freq. | Task | Impt. |
| agent ID | discrete (8 unique values) | high | search | 1.0 |
| price | continuous | low | boundary | 0.5 |
| quantity | discrete | high | estimate | 0.5 |
Table 1: A table showing the attributes to visualize during a TAC simulation, along with each attribute's domain (and number of unique values if it is discrete), spatial frequency, the tasks viewers want to perform on the attribute, and the attribute's relative importance
Since the dimensionality of the TAC is relatively small, we decided to bind luminance and hue into a single visual feature, colour. This allowed us to assign colours from a perceptually balanced path that spirals up around the luminance pole (this type of path also allows us to control colour surround errors, as described in \cite{War:88b}). After consultation with the TAC designers, we decided to allow quantity to be re-discretized into (as few as) three equal-width ranges. agent ID was not changed, since viewers need to identify specific agents during the simulation. Finally, ViA was not allowed to discard any of the analysis tasks.
Based on these restrictions, a total of nineteen M were evaluated. The smaller number of attributes and visual features, together with the constraints on how mappings could be modified, kept this number low (without these constraints, ViA would have evaluated 189 separate M). We also decided to ignore any M that used regularity; this allowed viewers to avoid the difficulties inherent in trying to detect differences in this visual feature. A number of promising M remained, including:
Each M's evaluation weight can be explained by identifying the strength and weaknesses of individual A_j → V_j pairs. Consider M_1, which contains three "weaknesses" that cause reductions in its overall weight:
Note that if we did not re-discretize quantity, its number of unique values (ten) would exceed the maximum number of usable densities (seven), reducing M_1's evaluation weight to 0.779.
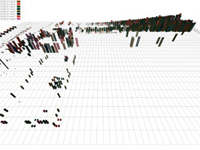
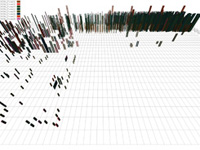
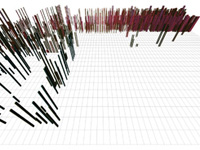
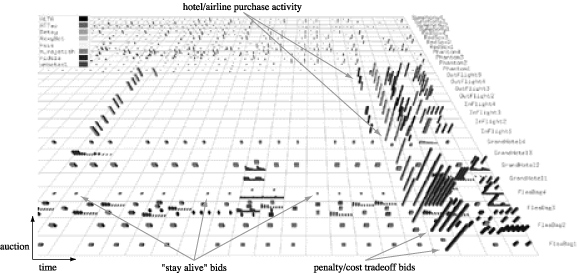
Figure 3: Student TAC data visualized with four different M: (a) M_1: agent ID → colour, price → height, quantity → density; (b) M_2: agent ID → colour, price → density, quantity → height; (c) M_3: agent ID → height, price → density, quantity → colour; (d) M_final: agent ID → colour, price → height, quantity → width
Figure 3a shows data from the student TAC visualized with M_1. Time increases from left to right along the horizontal axis. Each row corresponds to a specific auction. Viewers can clearly identify bids by different agents (via colour), bids with higher prices (taller pexels), and buy versus sell bids (buy bids lie above the plane, while sell bids lie below the plane). Other properties of the simulation are also visible. Consider the line of bids with steadily increasing prices in the upper-right corner. This represents a group of agents engaged in a bidding war over hotel rooms. Each agent is repeatedly raising its bid price in an effort to secure rooms for the days its customers want to travel. This is one example of M_1's ability to represent the strategies (or the possible lack of any strategy) employed by an agent.
The other M contain slightly different (and according to ViA, slightly more serious) problems. For example, M_2 receives the same penalties for agent ID → colour. In addition:
As with M_1, re-discretizing quantity to five or fewer ranges would remove the second penalty, increasing M_2's weight to 0.820.
Figure 3b shows the dataset being visualized with M_2. Although the data values are the same in Figures 3a and 3b, the resulting images are clearly different. For example, increases in price (i.e., in the bidding war area of the dataset) in Figures 3b are more difficult to detect. Density can only be used to represent a small collection of unique values, so price must be ranged (and must cross one of the range boundaries) to produce changes in the visualization. In fact, ViA identified this pairing as problematic, and penalized M_2 for using it. M_2 also contains potential advantages. Within the bidding war, bids for a given agent appear to have a fixed height. This shows that different agents are bidding for a different (but constant) number of hotel rooms. This makes sense, since each agent has specific needs based on the requests of its customers. This demonstrates why visualizing the same data in different ways can be beneficial: it will often highlight important aspects of a dataset that no single M can capture completely.
For M_3, ViA identified the following flaws:
Figure 3c shows the dataset being visualized with M_3. As noted during ViA's analysis, identifying agent ID with height is more difficult than with the colours used by M_1 and M_2. Visualizing price with density requires continuous prices to be discretized into price ranges. On the other hand, the use of fixed quantity during the hotel bidding war is easily seen, in this case as a constant colour for each participating agent.
After studying these mappings, we chose a modified version of M_1 for the final visualizations. Instead of using density to represent quantity, we varied the width of each pexel. This allowed us to handle a wider range of quantity values without having to combine them into a very small number of densities. It also allowed us to uncouple quantity from our implicit use of vertical density. Bids with a common time and auction ID are shown as pexels rendered one above another at a single grid location. Vertical density captures the level of activity occurring at various locations within the simulation.
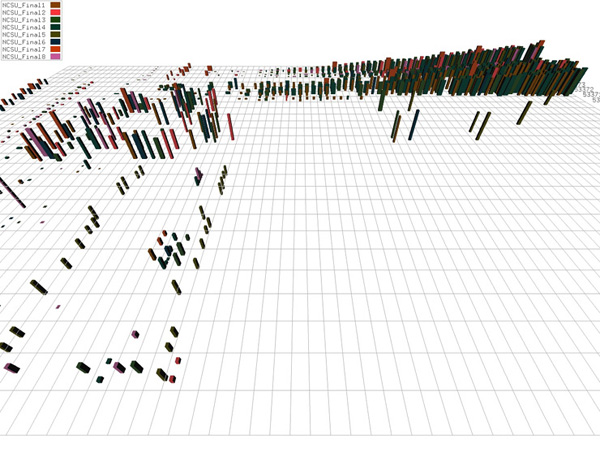
An example of our M_final is shown in Figure 3d. Visualizations are constructed and rendered together with a running TAC. This allows viewers to track agent activity in real-time as the simulation unfolds, and to see the different strategies the agents employ to try to achieve their auction goals.
Figure 4: ICMAS TAC data visualized with M_final (agent ID → luminance, price → height, quantity → width); more sophisticated agent strategies are visible in these displays
Figure 4 shows a dataset from one of the ICMAS TAC simulations. The same M_final is used to visualize the data. Finalists at ICMAS used much more sophisticated agent strategies, some of which are clearly visible in our visualizations. For example:
Some agents would periodically make very low buy bids for hotel rooms to ensure the hotel auctions did not close prematurely.
Most agents deferred purchasing hotel rooms and airline tickets until just before the simulation ended, since they felt there was no advantage to early purchase (particularly for hotel rooms, where attempts at early purchase can drive up the final price).
If hotel rooms for a given customer cannot be found, the customer's entire trip is cancelled, and the agent is penalized the cost of any airline and entertainment tickets they may have purchased on the customer's behalf. Some agents estimated the cost C of this penalty, then made late bids for hotel rooms at a buy price of C. These agents decided that paying C for a hotel room was no worse than paying a penalty of C for unused airline and entertainment tickets. More importantly, there is a good chance that the hotel rooms will sell for less than C (that is, the sixteenth winning bid for a room is made by some other agent with a buy price less than C.) If this happens, the agent will make a profit relative to the scenario of not securing the hotel room.
This paper describes ViA, a semi-automated visualization assistant designed to help viewers construct perceptually sound visualizations for large, multidimensional datasets. Viewers begin by providing domain-independent information about their dataset and analysis requirements. ViA uses perceptual evaluation engines and mixed-initiative search techniques to identify candidate visualizations that are best suited to the given data and tasks. Viewers can constrain ViA to respect their preferences, or to include contextual cues that should appear in the final visualizations. The result is a system that can rapidly identify effective visualizations for a wide range of real-world environments.
We discuss in detail how ViA was used to design visualizations for datasets from an e-commerce auction (TAC) simulation. Candidate mappings M were selected based on a number of restrictions specified by the TAC designers. ViA correctly identified the strengths and weaknesses of each of these M, producing a high-weight result that led directly to our final visualization design. This M_final allows observers to track the progress of different e-commerce agents as a simulated auction unfolds. It also highlights different strategies used by the agents to try to meet their auction goals.
Although we chose e-commerce data to demonstrate the practical uses of ViA, we are not limited to only this type of environment. For example, ViA selected the M used to visualize the weather data shown in Figure 1. Plans to include additional visual features (i.e., orientation and motion) during evaluation will further improve ViA's expressiveness and flexibility.
This work is supported by National Science foundation research grants NSF-IIS-9988507 and NSF-ACI-0083421. We would also like to offer special thanks to Peter Wurman, Kevin O'Malley, and Michael Wellman for their assistance, advice, and expertise on interpreting TAC results.