Visualizing NFL Football Games
Christopher G. Healey
Department of Computer Science, North Carolina State University
Note: Visualizations of the current 2012-2013 NFL season are now available online.
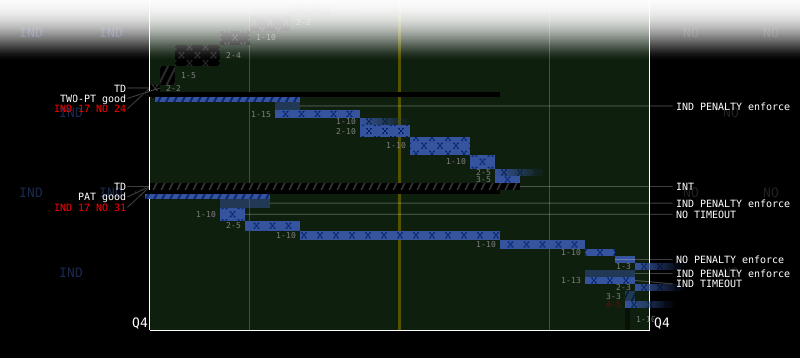
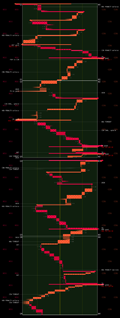
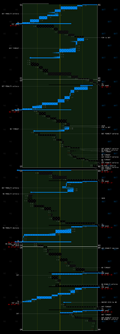
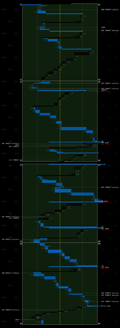
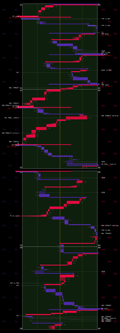
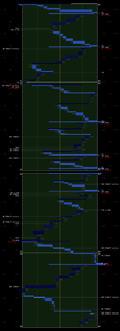
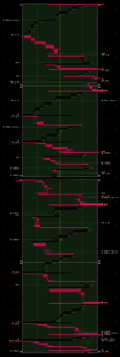
Fig. 1. A visualization of the final plays during the 4th quarter of the 2010 Super Bowl game (Indianapolis's end zone on the left, New Orleans's end zone on the right), where the Indianopolis Colts were unable to overcome New Orleans's lead during their final two possessions
Visualizations of each of the 2011-2012 playoff games are available at the bottom of the web page:
Visualizations of NCAA college games, including the 2007/2008 BCS Bowl Games, are also available here.
Introduction
Research in our laboratory focuses on visualization, the conversion of large collections of strings and numbers into images that viewers can use to explore and discover within their data.
Although we study a number of "serious" application domains, we also visualize data based on a personal interest, or on its popularity in the public-at-large. Our visualization of play-by-play results for National Football League (NFL) football games is one example of this type of project.
NFL Game Play-by-Play
The National Football League is the largest professional American Football league. The goal of the game is to score points by advancing an oval-shaped ball (the football) towards the opponent's end zone by carrying it (a rushing play), throwing it (a passing play), or kicking it. A description of the game's rules are available from wikipedia, or from nfl.com.
The NFL consists of thirty-two teams, split evenly into two conferences: the American Football Conference (AFC) and the National Football Conference (NFC). Both conferences are further divided into four four-team divisions. Each team plays sixteen games during a seventeen-week season (one game per week, plus a single "bye" week with no game). Following the regular season, the top six teams from each conference advance to the playoffs, a single-game elimination format that ends with a winner of the championship Super Bowl game.
Each game is made up of individual plays: passing, rushing, kicking, and so on, as well as scoring plays (e.g. touchdowns or field goals), penalties, possession changes (e.g. fumbles or interceptions), and a variety of other in-game events. Beginning in 2001, this sequence of plays is recorded and published on the NFL web site, as play-by-play text, for each regular season and playoff game.
We were curious about whether presenting play-by-play information in a visual format would provide any particular advantages over the traditional text listing. Seeing the plays as they unfold might provide insights into the types of offensive or defensive strategies different teams employ, either in a general sense, or depending on the current state of a given game. For example, many teams focus on rushing plays to "run time off the clock" when their team is leading and the end of the game is near, while their opponents try to call their available timeouts to stop the clock and preserve time for a final offensive push.
We decided to convert the NFL's play-by-play text into a visualization of the plays within a particular game. In order to do this, we had to solve two problems. First, we need to parse the play-by-play text into a format that unambiguously describes each play. Second, we must to convert the play-by-play descriptions into an effective visual representation.
Parsing Play-by-Play Text
The NFL makes their play-by-play text available online in a HTML/XML format. English language is used to describe each play, with only a few very general XML tags to identify different types of plays. This means that most of the parsing has to occur by-hand.
Some play-by-play text is easy to parse, for example:
- 2-10-PIT 20 (14:53) (Shotgun) 7-B.Roethlisberger pass short right to 83-H.Miller to PIT 26 for 6 yards (52-D.Smith).
During the 2008 Wild Card playoff game between the Jacksonville Jaguars and the Pittsburgh Steelers, at 14:53, on second down and 10 yards-to-go from the Pittsburgh 20 yard line, a pass is made to advance the ball to the Pittsburgh 26 yard line (a gain of 6 yards). For this play, we record the time (14:53), the down (2), the yards-to-go (10), the starting position (PIT 20), the type of play made (pass), and the ending position (PIT 26).
Other text is more complicated:
- 2-10-JAC 14 (10:29) 7-B.Roethlisberger pass short middle to 83-H.Miller for 14 yards, TOUCHDOWN. TWO-POINT CONVERSION ATTEMPT. 7-B.Roethlisberger pass to 86-H.Ward is complete. ATTEMPT SUCCEEDS. PENALTY on PIT-61-S.Mahan, Offensive Holding, 10 yards, enforced at JAC 2 - No Play.
This snippet contains three separate plays. On 2nd and 10 from the Jacksonville 14, a pass is made for a touchdown. Pittsburgh elects to attempt a two-point conversion, which succeeds. However, a penalty is called on the play, negating the successful attempt. All of this information must be recorded, in the correct order, to properly track the flow of the game.
Additional difficulties include extra information occasionally inserted into the play-by-play text:
- 1-10-DAL 23 (:28) (Shotgun) 10-E.Manning pass incomplete deep middle to 17-P.Burress. Pass incomplete on a post pattern in the back of the end zone.
The play-by-play observer has included an explanation of why a pass play was incomplete. During parsing, however, it is hard to determine whether this is one pass incomplete play or two. Because an explanation is non-standard (i.e. most play-by-play text does not include it), the parser cannot simply guess that the second "pass incomplete" represents a description of the play.
There are also cases where missing or incorrect information is provided:
- 4-9-NO 16 (12:49) 7-S.Weatherford punts 48 yards to CHI 36, Center-47-K.Houser. 23-D.Hester for 64 yards, TOUCHDOWN.
- 9-R.Gould kicks 66 yards from CHI 30 to NO 4. 24-C.Barclay to 50 for 46 yards (21-C.Graham). PENALTY on NO-51-B.Simmons, Offensive Holding, 10 yards, enforced at NO 22.
A touchdown is scored by Chicago during a punt return. However, the point-after attempt that follows the touchdown is missing. The "score" line that presents the updated score after each scoring play is also omitted. Without information about the type of point-after attempted (a one or two-point conversion) and its success or failure, is impossible to know what the game's current score is.
Our parser does its best to compensate for these types of situations. We enforced two design decisions when we implemented the parser. First, we do not hand-correct the parser's output. This means that all interpretations must be handled automatically by the parser. Second, we do not to try to "guess" about where the play-by-play text might be incorrect. This means that if an error exists in the play-by-play, it will propagate into the parser's output.
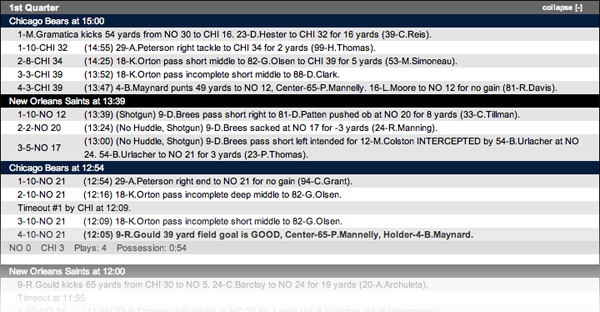
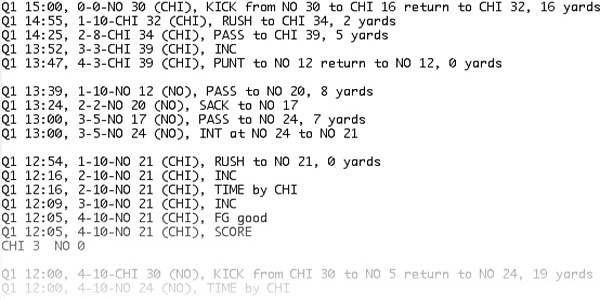
We record (up to) 13 separate attributes for each play: (1) type of play; (2) team with possession; (3) quarter; (4) game time within quarter; (5) down; (6) field position; (7) yards to go; (8) position ball advances to; (9) position ball returns to, e.g. on interceptions, fumbles, punts, kicks, and so on; (10) recipient of an event, e.g. for penalties, challenges, timeouts, and so on; (11) whether an event is applied, e.g. penalty enforced or declined, challenged play reversed or upheld, and so on; (12) home team score; and (13) away team score. Fig. 3 shows an example of play-by-play text from the nfl.com site, and the corresponding output produced by our parser.
Visualizing Play-by-Play Results
(a)
|
(b)
|
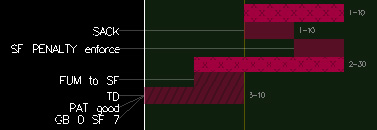
| Fig. 2. Examples of play glyphs and event tags: (a) kick, pass, rush, and pass incomplete glyphs; (b) play tags to identify sacks, penalties, fumbles, and scoring plays |
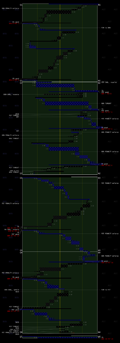
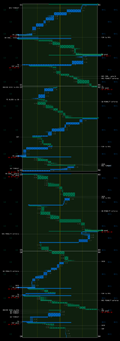
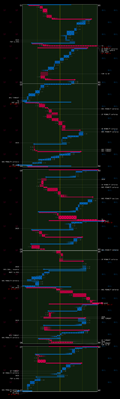
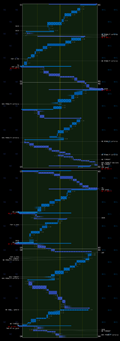
Once the play-by-play results have been parsed, they must be visualized. Our goal is an image that shows the flow of the game in an efficient and effective manner. In particular, we want viewers to be able to quickly identify the location of the ball at any time during the game, the types of plays that are run during a possession, and where various critical events occur.
Plays are overlaid on a two-dimensional plane, where field position runs in the x-direction, and time runs in the -y-direction. The home team's end zone is on the left, and the away team's end zone is on the right. Each play is displayed as a rectangular glyph, with the from and to positions of the ball during the play defining the glyph's horizontal width, and the start and end times of the play defining it's vertical height. The glyph is coloured with the appropriate team colour, as defined by the NFL web site.
Plays are divided into four basic types: pass, rush, kick, and other. The play glyphs are modified to visually differentiate the play types (Fig. 2). Pass plays texture small X's onto the play glyph. Completed passes are shown as a solid glyph. Glyphs for incomplete passes fade out at their endpoint. Rush plays texture small strips onto the glyph. Kicks add an arrow to the glyph to show the direction of the kick. Any other types of ball movement (e.g. changing the ball position due to a penalty) leave the glyph unchanged.
Important plays are tagged with a text label to highlight them in the play sequence. For example, in Fig. 2b the away team (San Francisco) passes for 20 yards, is sacked for -10 yards, is penalized for -10 yards, passes for 30 yards then fumbles and recovers for -10 yards, and finally rushes 20 yards for a touchdown. The sack, penalty, fumble, and score plays are tagged to identify them to the viewer.
2011-2012 NFL Playoff Visualizations
Future Work
We have recently updated our prototype with a number of necessary improvements. Proper contrast colours are selected to ensure that dark team colours (e.g. the black glyphs representing Pittsburgh) are textured with light elements, while lighter colours are textured with dark elements. The original team colours taken from the NFL web pages are very similar in a number of cases (e.g. the "blue" teams like New England, San Diego, New York Giants, and Dallas that met one another during the 2008 playoffs). We used a luminance-saturation-hue colour space to brighten all the team colours, and to "push" team colours away from one another in the saturation channel when they are too similar.
Other work still remains to be completed.
Currently, HTML/XML parsing is done in Java, while the visualizations are rendered in OpenGL and C++. We will convert the rendering code to Java and some appropriate 2D graphics API (e.g. Swing). This will allow the entire program to run as an applet. Web code can then be wrapped around the applet, to allow it to dynamically query and visualization any game an online user requests.
Finally, we are planning to extend our visualizations to other leagues, in particular, to NCAA Division I college games. Online play-by-play exists for these games, so the only requirement is that we re-write our parser to properly interpret the play-by-play language the NCAA is using.
Acknowledgments
We would like to thank NFL Properties LLC (NFLP) for their permission to use feed data from nfl.com as part of our research project. Please note that this use is specifically for non-commercial, non-marketing purposes.